


fig8
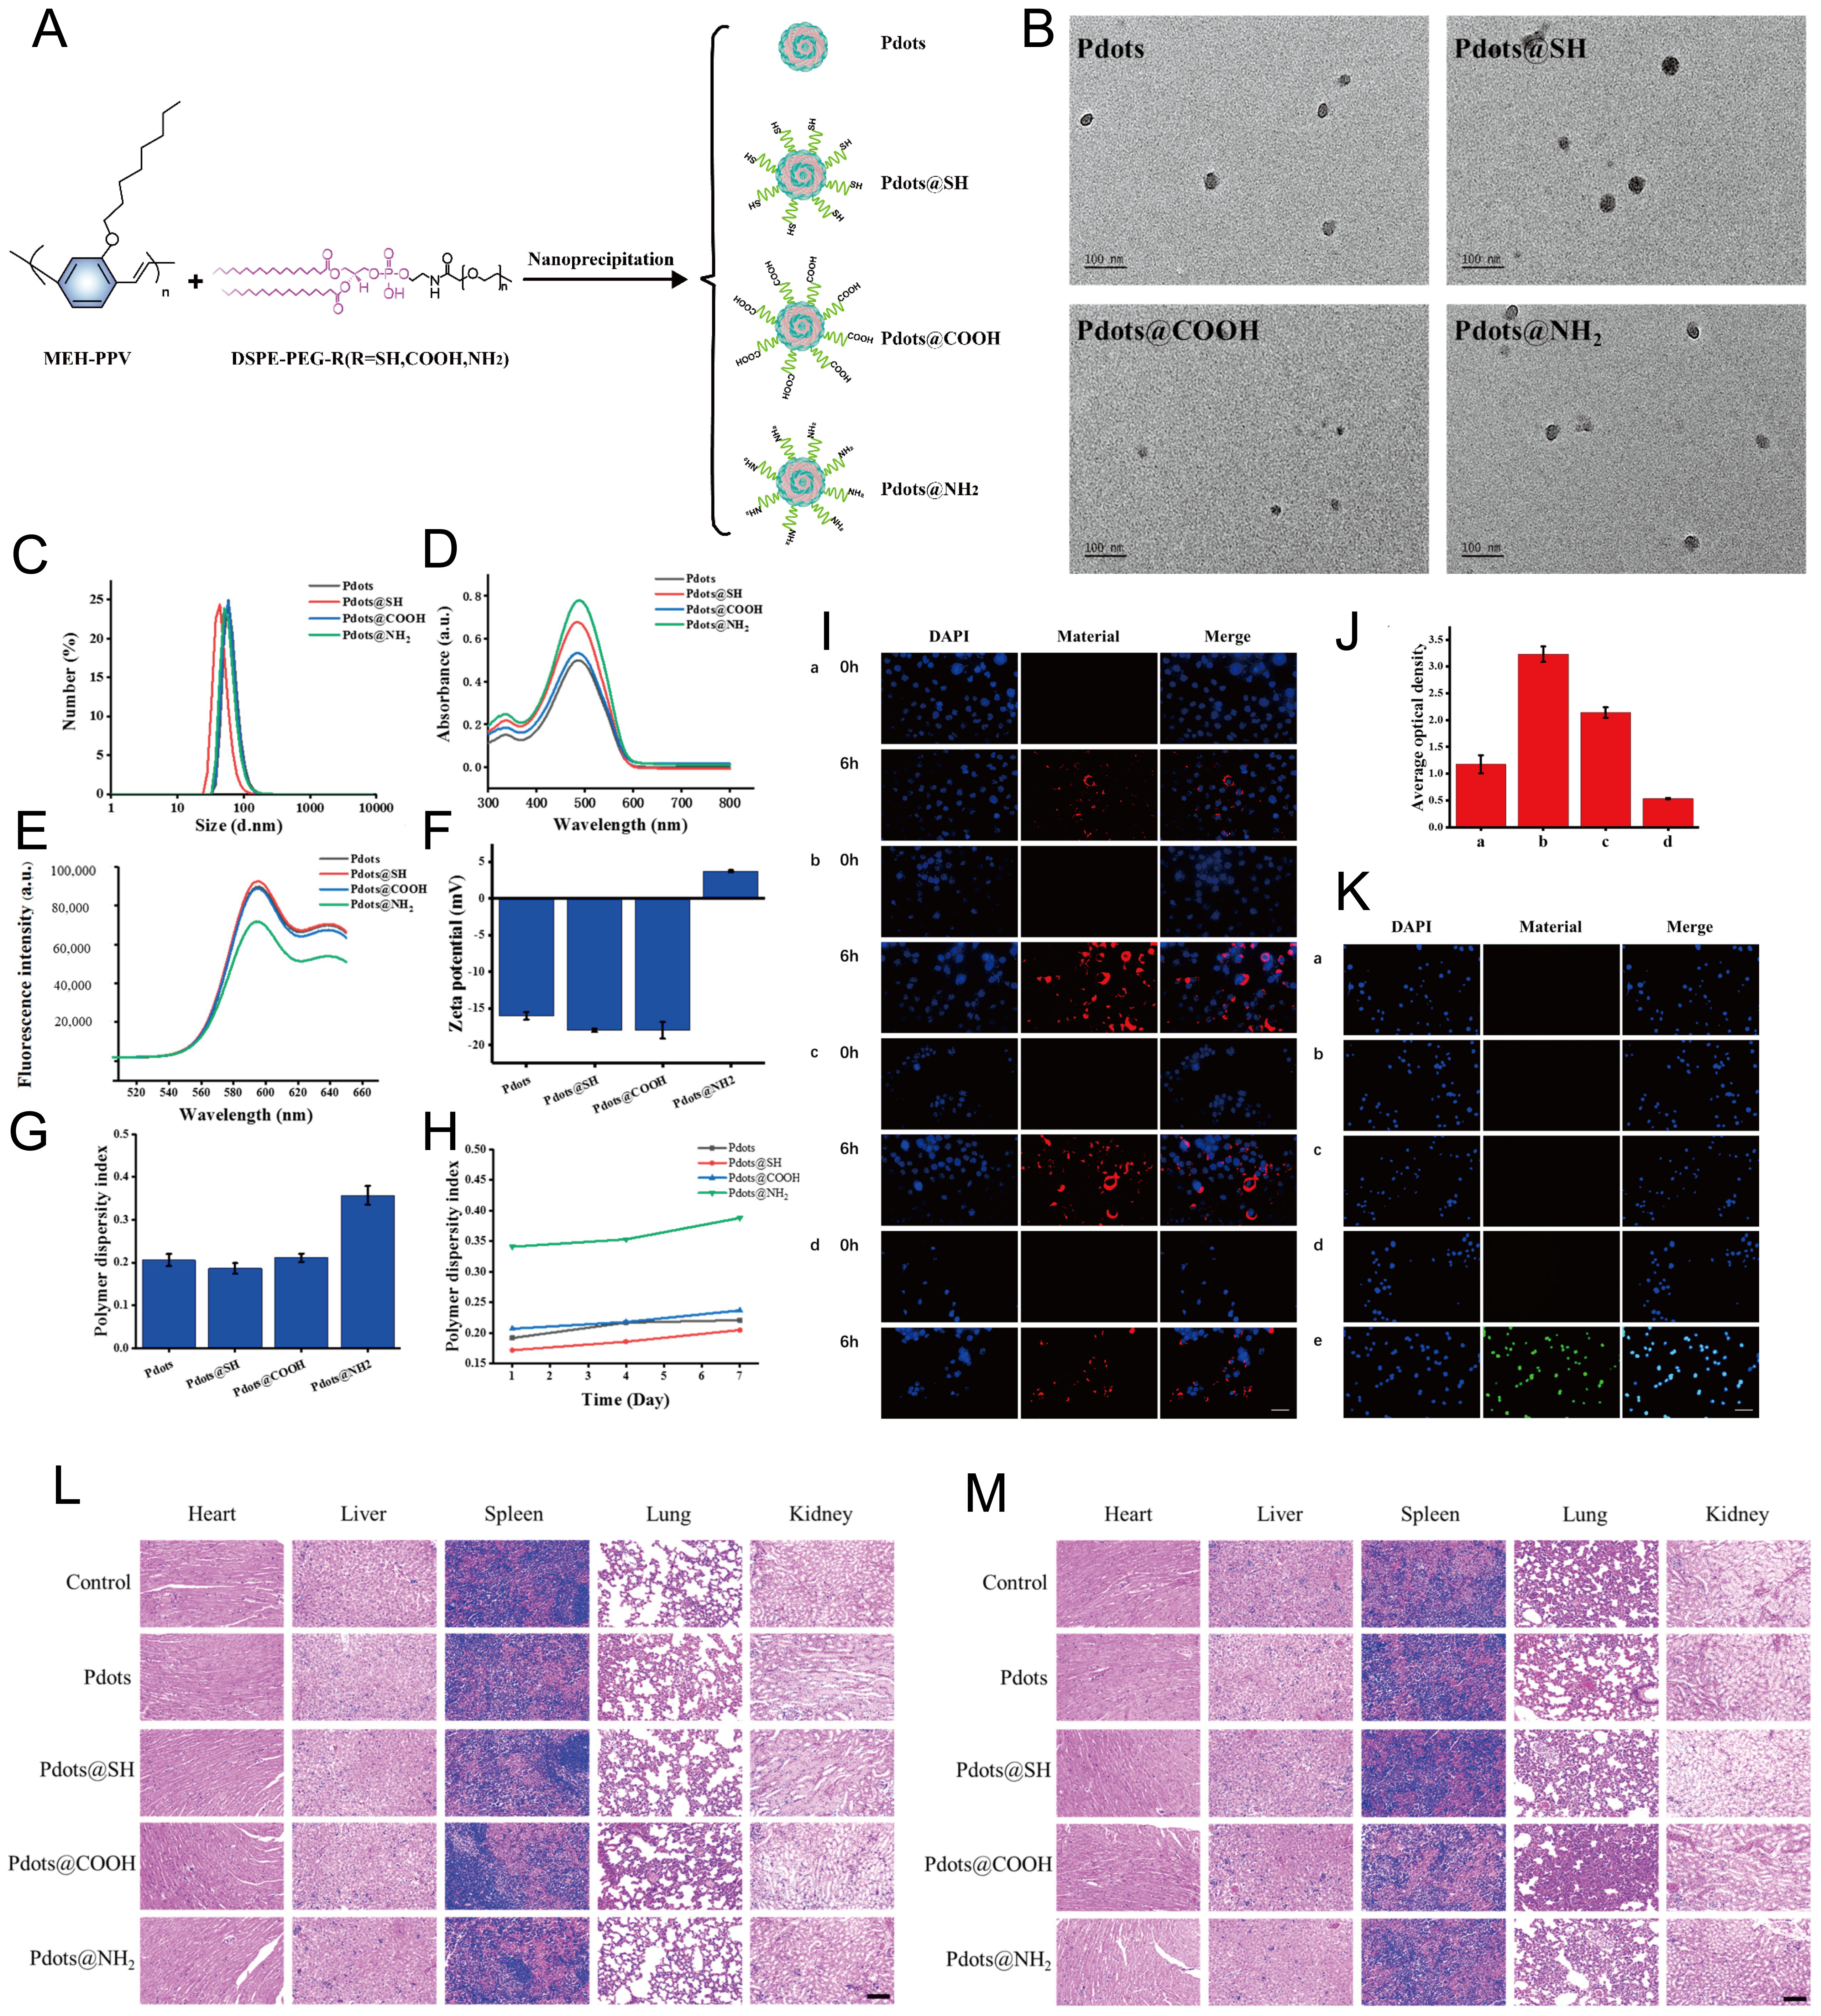
Figure 8. Figure synthesis and characterization of Pdots. (A) The synthesis protocols for Pdots, Pdots@SH, Pdots@COOH, and Pdots@NH2 were established. (B) The morphologies of Pdots, Pdots@SH, Pdots@COOH, and Pdots@NH2. (C) The hydrodynamic size distributions of all Pdot variants. (D) UV-Vis-NIR absorption spectra for each functionalized Pdot. (E) Fluorescence emission spectra demonstrated the optical properties of Pdots and their derivatives. (F) Surface charge characteristics were evaluated via zeta potential measurements. (G) Polymer dispersity indices were calculated to assess colloidal stability. (H) Temporal PDI stability was monitored over time. (I) CaSki cell uptake after 0/6 h incubation with: (a) Pdots, (b) Pdots@SH, (c) Pdots@COOH, and (d) Pdots@NH2 (red = Pdots, blue = DAPI-stained nuclei; scale bar = 50 μm). (J) Quantitative analysis of cellular fluorescence intensity at 6 h. (K) ROS generation detected by DCFH-DA (green) in CaSki cells treated with (a) Pdots, (b) Pdots@SH, (c) Pdots@COOH, (d) Pdots@NH2, and (e) positive control (blue = DAPI).


