


fig6
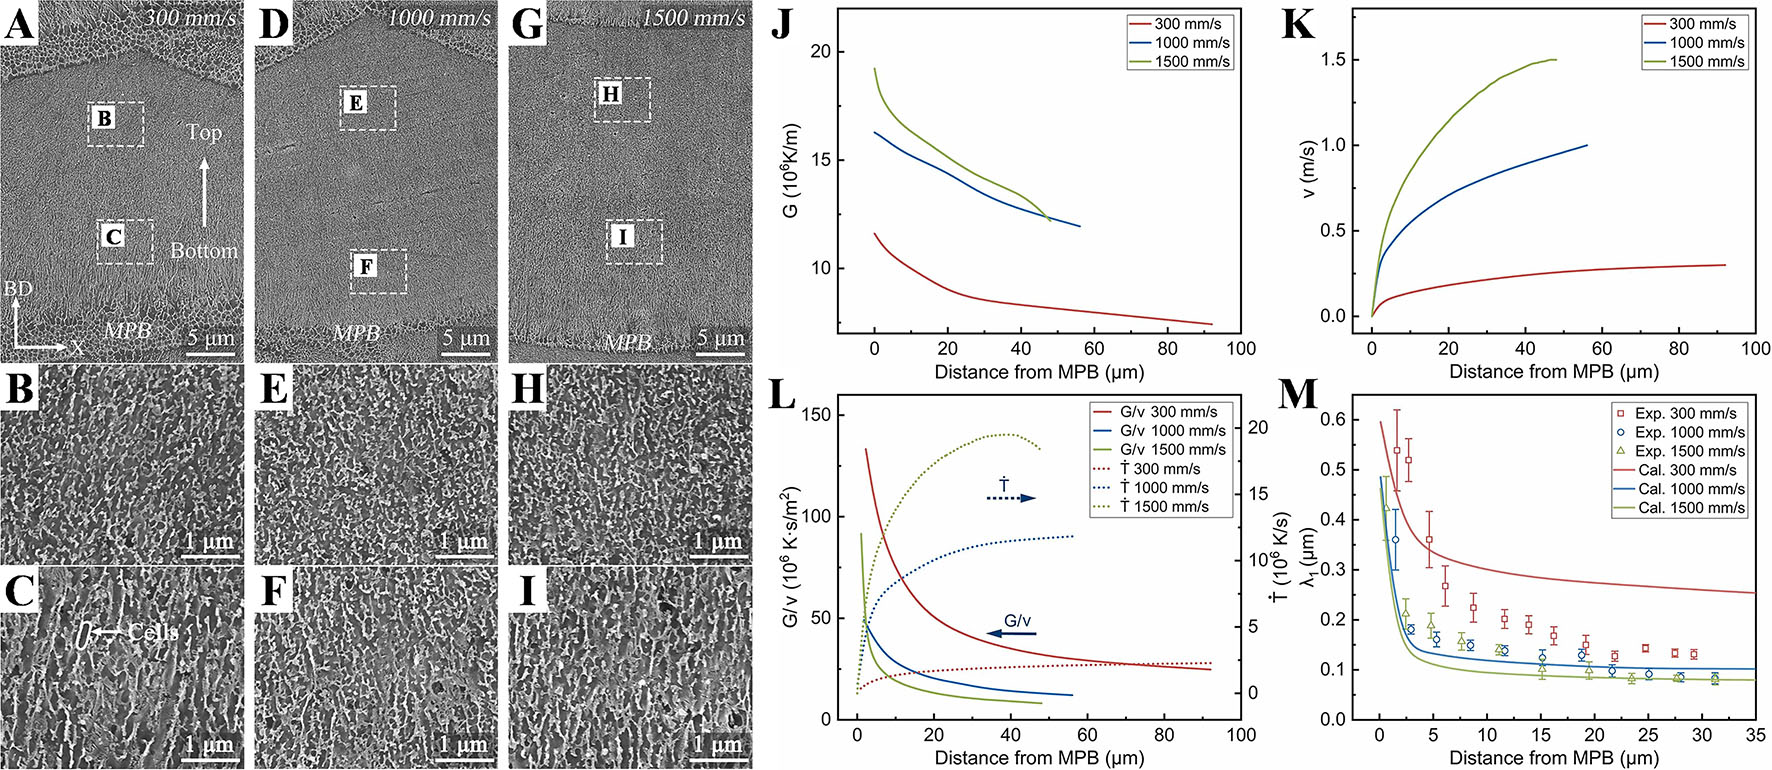
Figure 6. SEM images of pronounced cellular structures form the bottom to the top of melt pool at laser scanning speed of 300 mm/s (A); 1,000 mm/s (D); 1,500 mm/s (G) in the near eutectic Al-Ni-Sc-Zr alloy fabricated by L-PBF; Magnified images of cellular structures at different positions of the melt pool at scanning speed of 300 mm/s (B and C); 1,000 mm/s (E and F); 1,500 mm/s (H and I); Variation of G (J) and V (K) at the S-L interface; (L) Curves of G/V and cooling rate


