


fig12
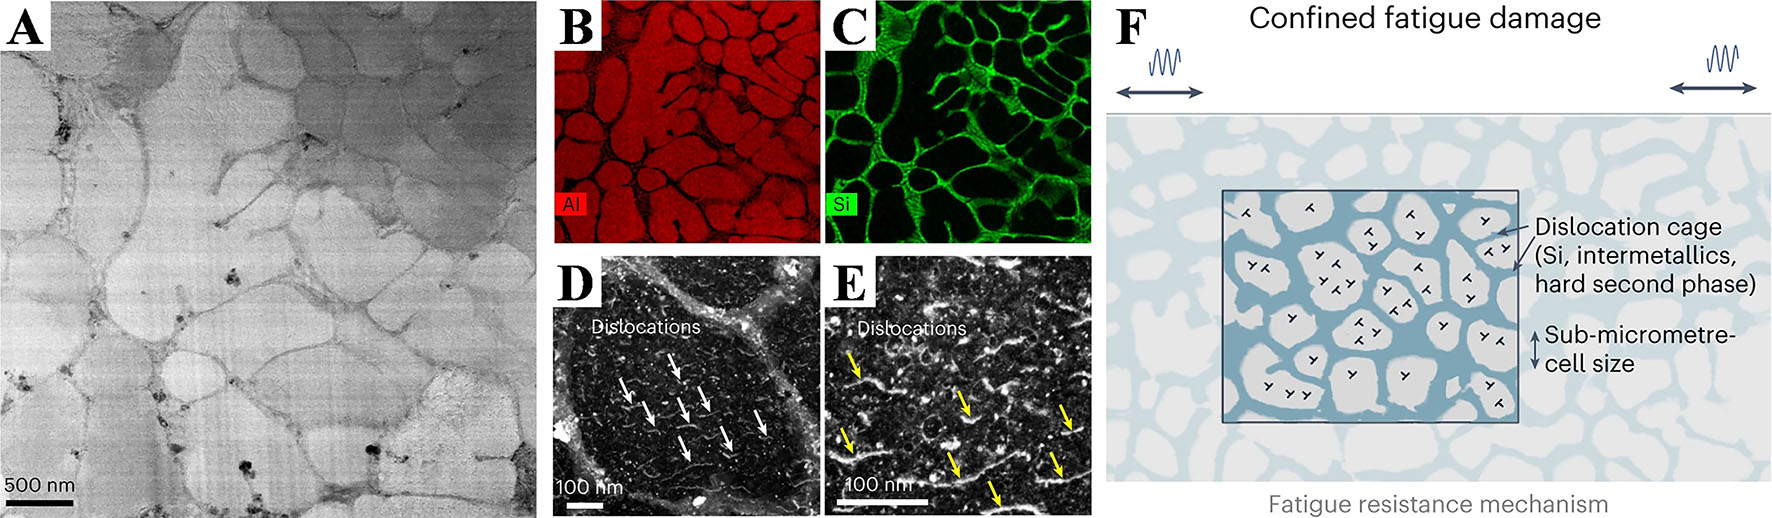
Figure 12. (A) TEM characterization of the intact Si cellular structure on the nano-TiB2-decorated AlSi10Mg after 107 fatigue cycles at a maximum stress of 260 MPa (R = 0.1); EDS maps for local element distribution of Al (B) and Si (C); (D and E) Individual dislocations inside the Si nanocellular structure; (F) Schematic showing the fatigue resistance mechanism[144].


