


fig4
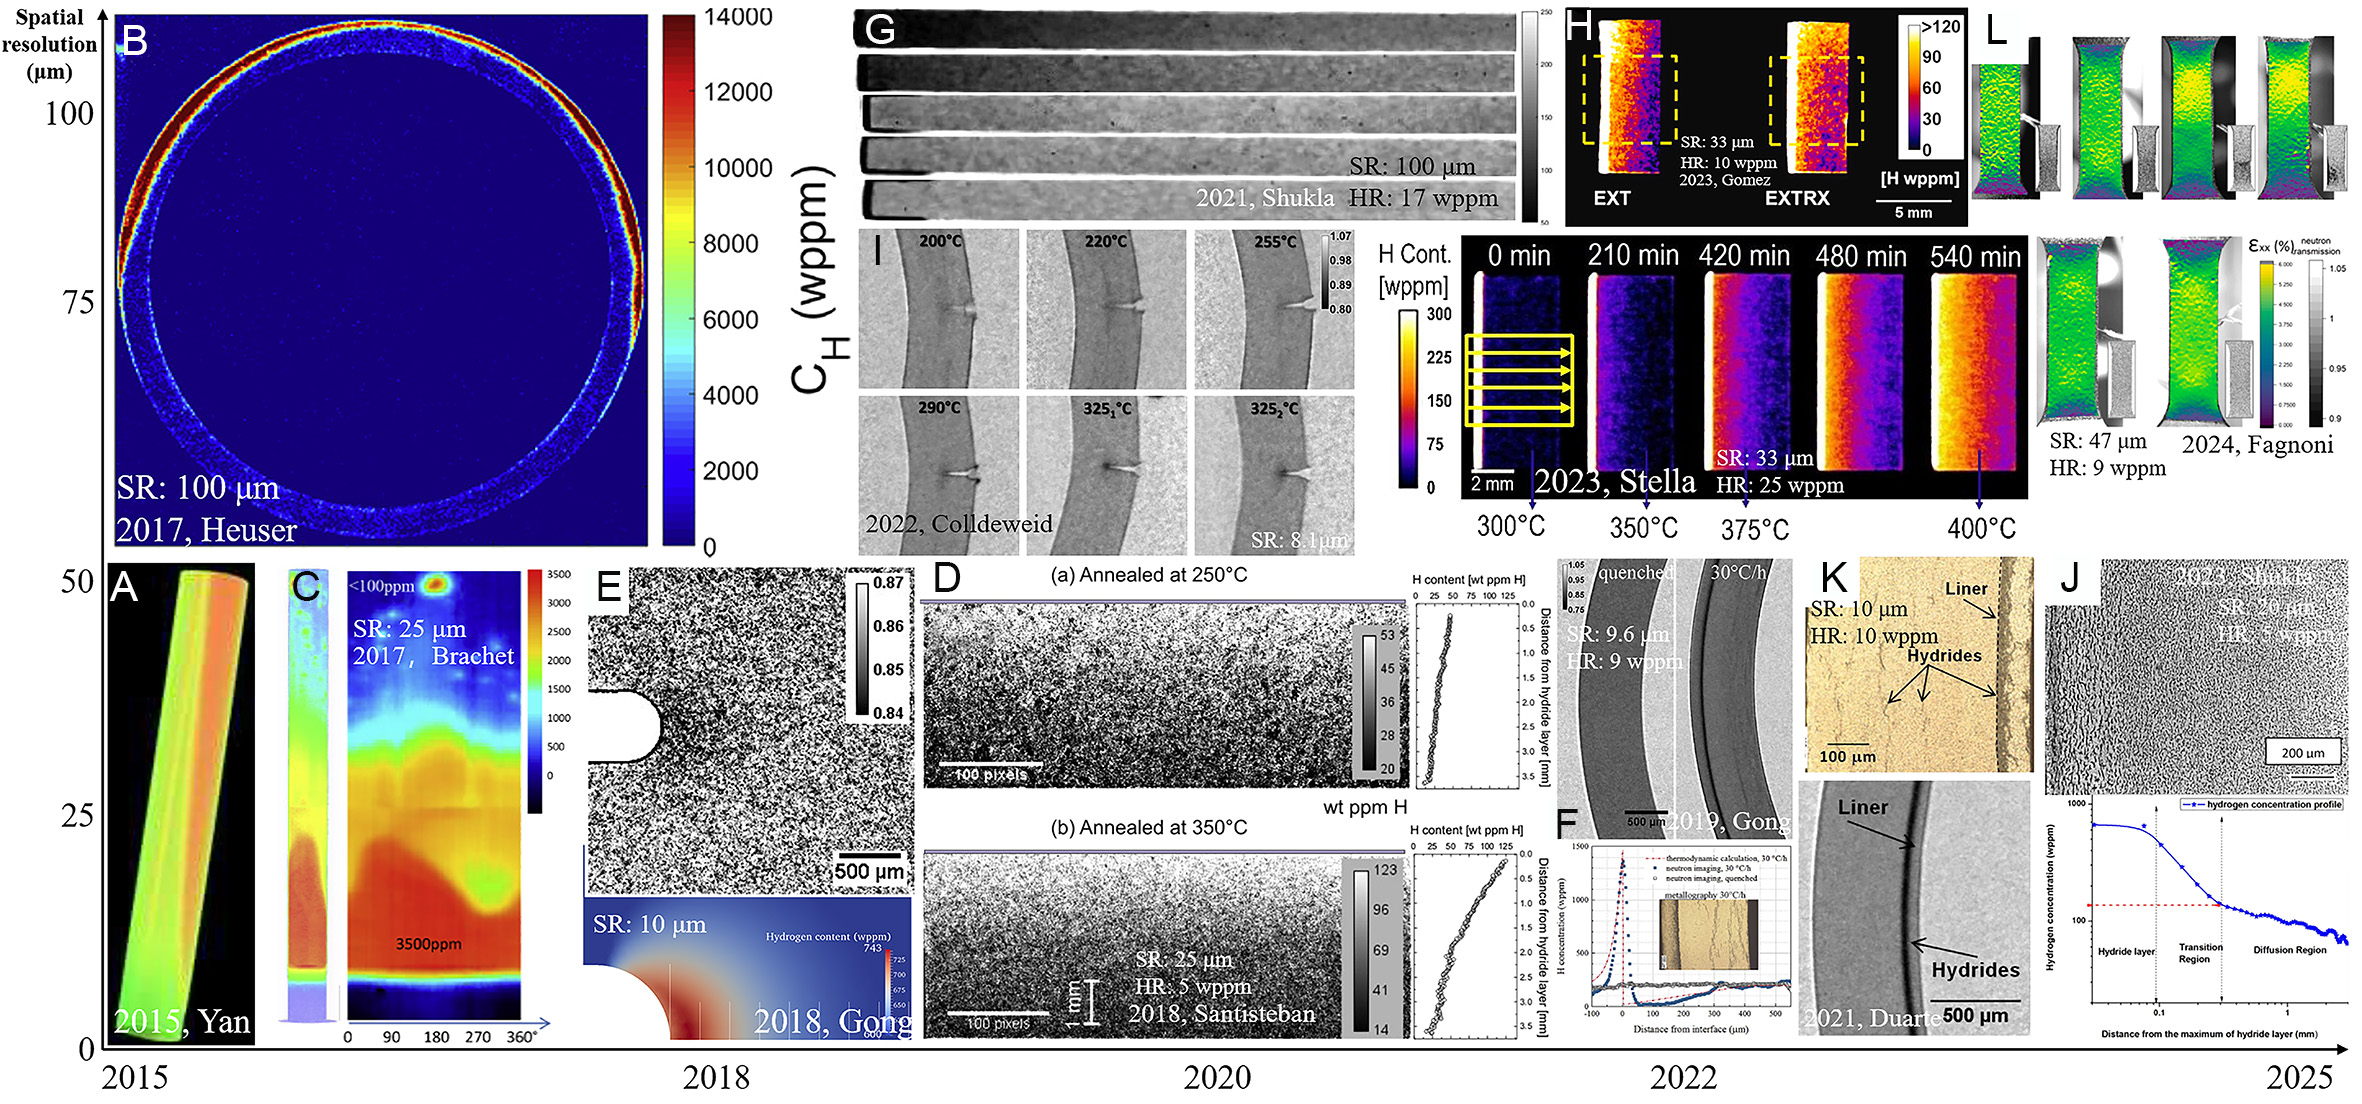
Figure 4. Neutron imaging resolution of hydrogen in Zr alloys optimizing with time: (A) 3D uneven hydrogen distribution in Zr-4[45], (B) hydrogen concentration of hoop stress tube[29], (C) tomographic hydrogen concentration distribution of clad segment[45], (D) hydrogen concentration in two inhomogeneous Zr-2.5Nb[3], (E) transmission of thermo-mechanical tested Zr-4 and stress field near the notch[46], (F) transmission imaging of the duplex cladding tubes[25], (G) annealed Zr-2.5Nb for displaying hydrogen diffusion[31], (H) hydrogen concentration maps for samples after annealed[27], (I) DHC in Zr-2 with integral 200 wppm hydrogen[26], (J) optical micrograph of Zr-2.5Nb annealed samples for diffusion rate and hydrogen concentration obtained by quantitative neutron imaging[32], (K) transmission imaging of the images of Zr-2 based cladding[49], (L) strain and hydrogen distribution maps of Zr-4 tensile samples[51].


