


fig3
From: Neutron imaging quantifying hydrogen diffusion and distribution in metallic materials - a review
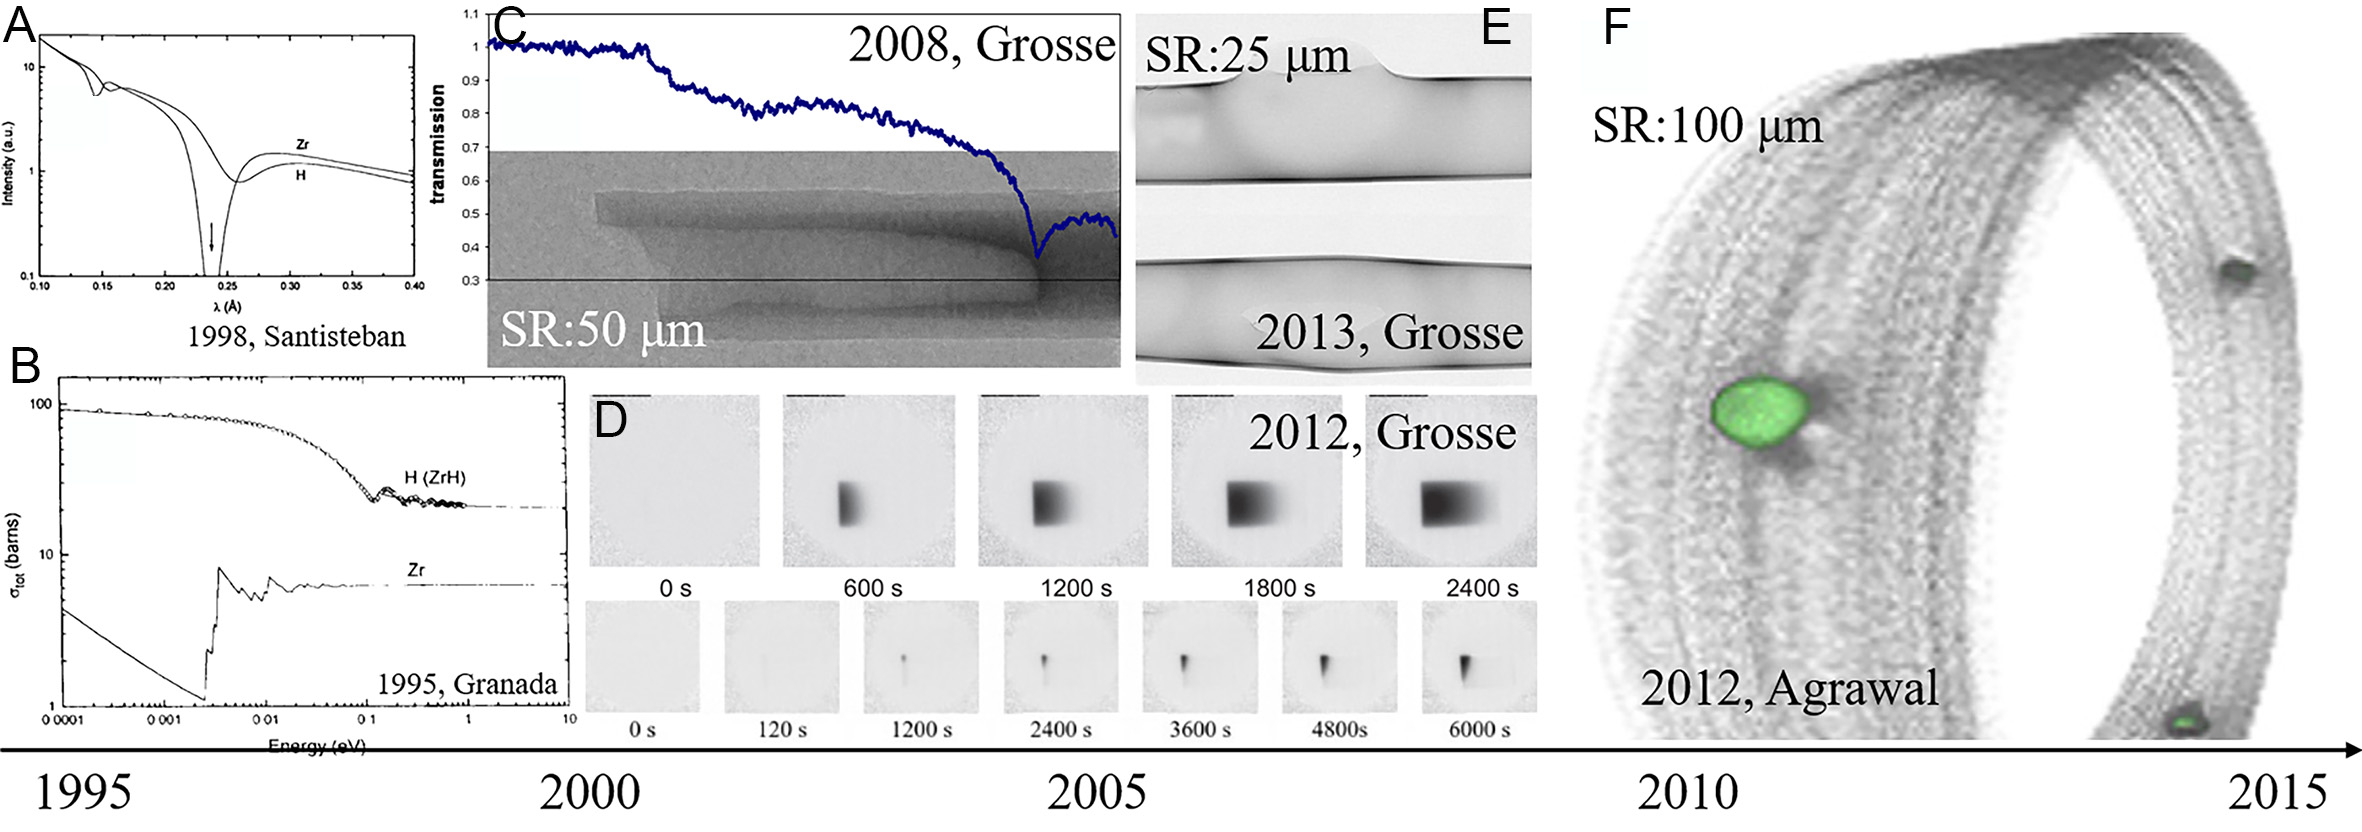
Figure 3. Neutron imaging development from 1995 to 2015: (A) the neutron scattered time of flight spectra by H and Zr[35], (B) cross sections of Zr and H in ZrH alloy[34], (C) neutron images of Zr-1Nb rod[23], (D) hydrogen diffusion at 1,273 K and 823 K in Zr-4[39], (E) 3D volume of pressure tube with blisters[37], (F) 3D tomography of the hydride blister in Zr-2.5Nb[43].


