


fig8
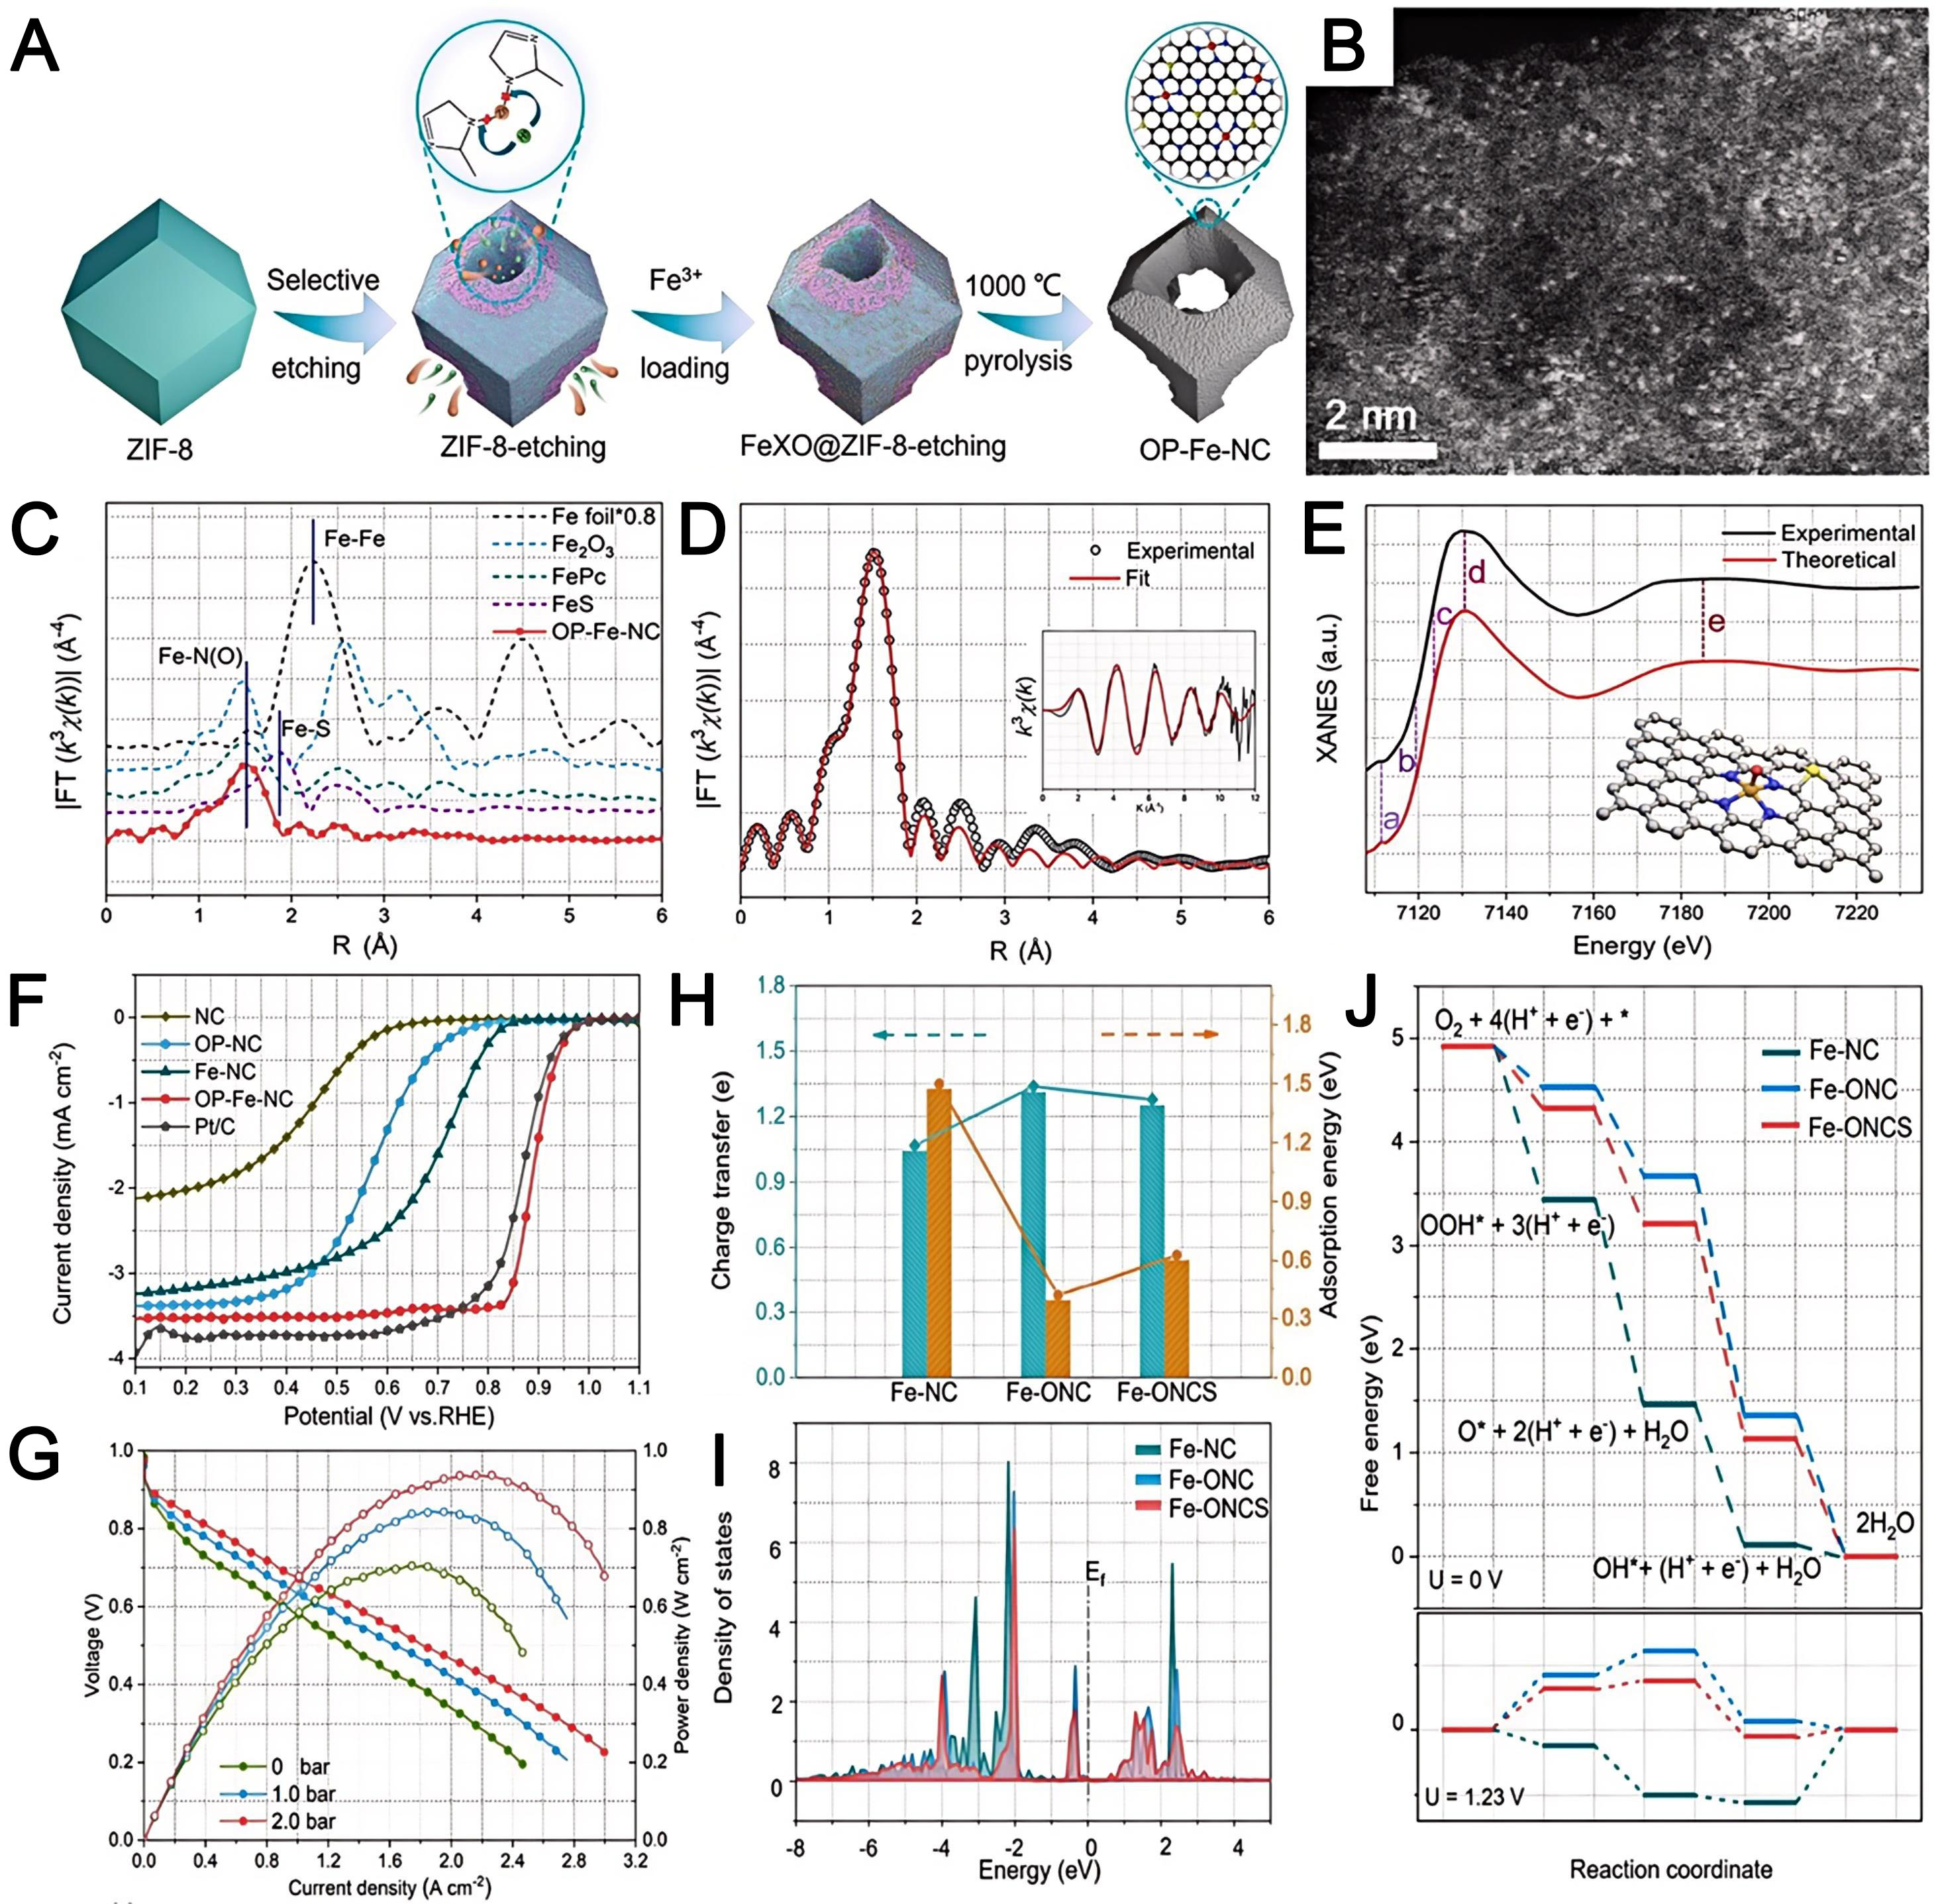
Figure 8. (A) Schematic and (B) HAADF-STEM image of OP-Fe-NC; (C) Fourier transformed EXAFS spectra of OP-Fe-NC catalysts; (D) corresponding quantitative fittings of the EXAFS spectra in R space. Inset shows the corresponding EXAFS fitting in K space; (E) Comparison between the experimental and theoretical X-ray absorption near-edge structure (XANES) spectra. Inset is a schematic of the interfacial model of OP-Fe-NC; (F) LSV curves; (G) polarization and power density curves of H2-O2 fuel cells with OP-Fe-NC and


