


fig4
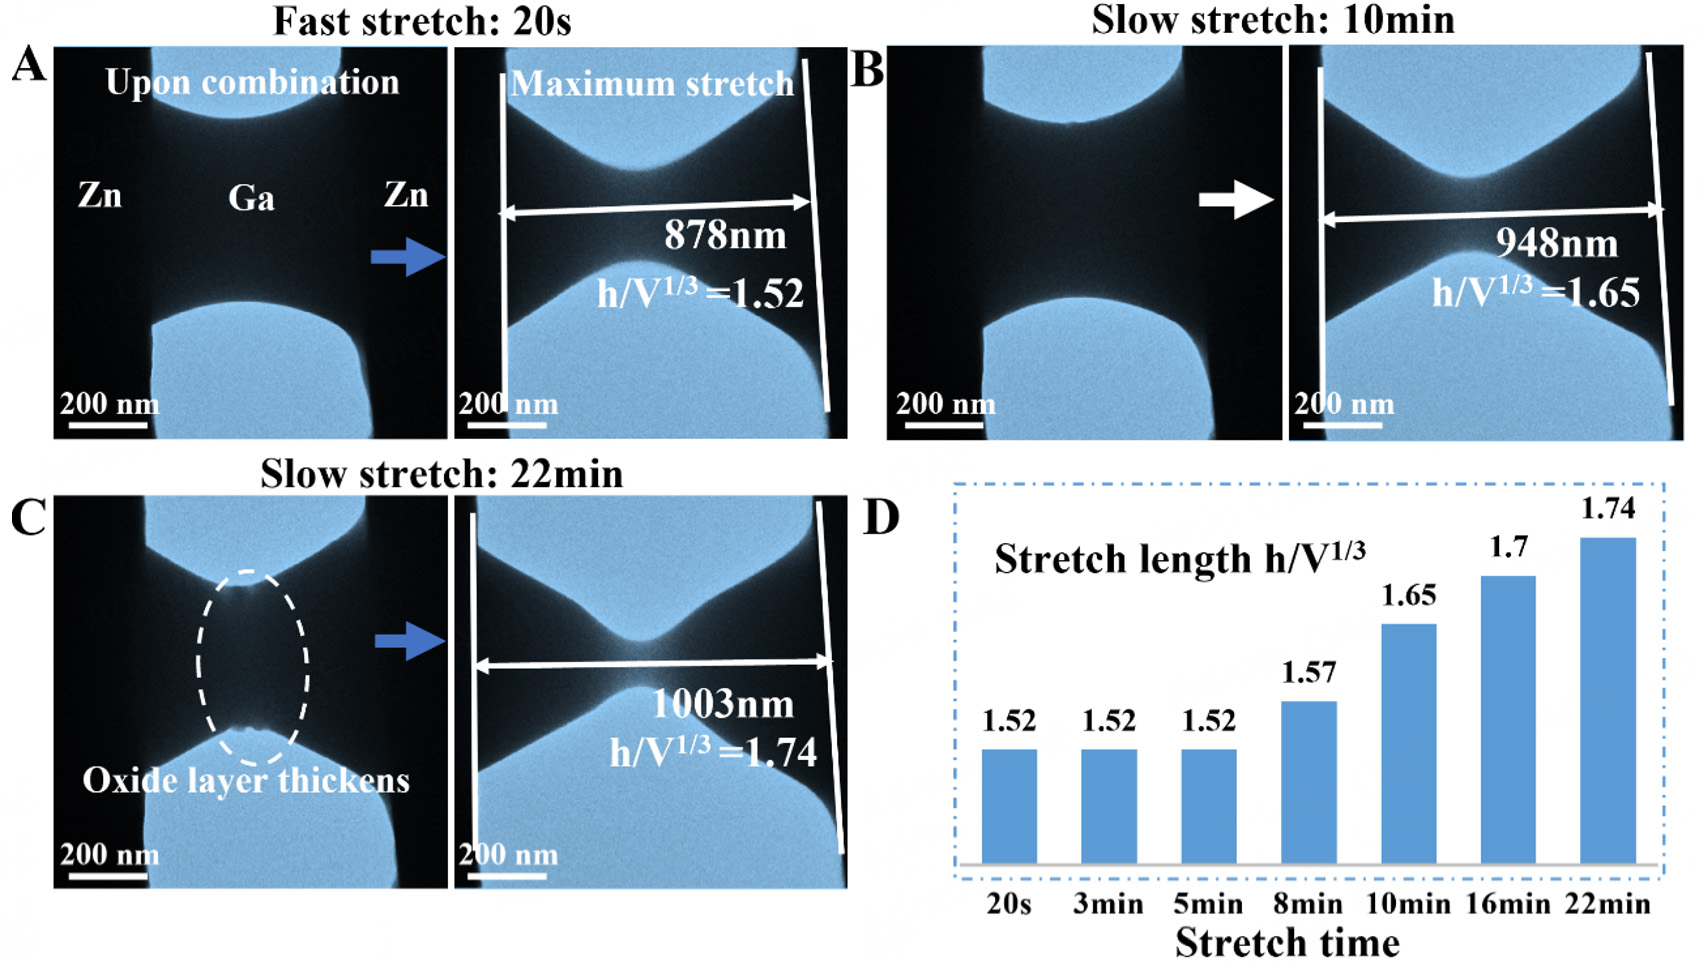
Figure 4. Regulation of LM bridge stretching via oxide layer thickness modulation. (A) In situ TEM images of the initial and final states of the LM bridge on Zn substrate during a rapid stretch process (20 s). (B) In situ TEM images of the slow stretching process of the LM bridge at 8 min. (C) In situ TEM images of the stretching process at 22 min. (D) Statistical plot of maximum stretching length (hc) vs. stretching duration, illustrating the correlation with oxide layer growth rates.


