


fig15
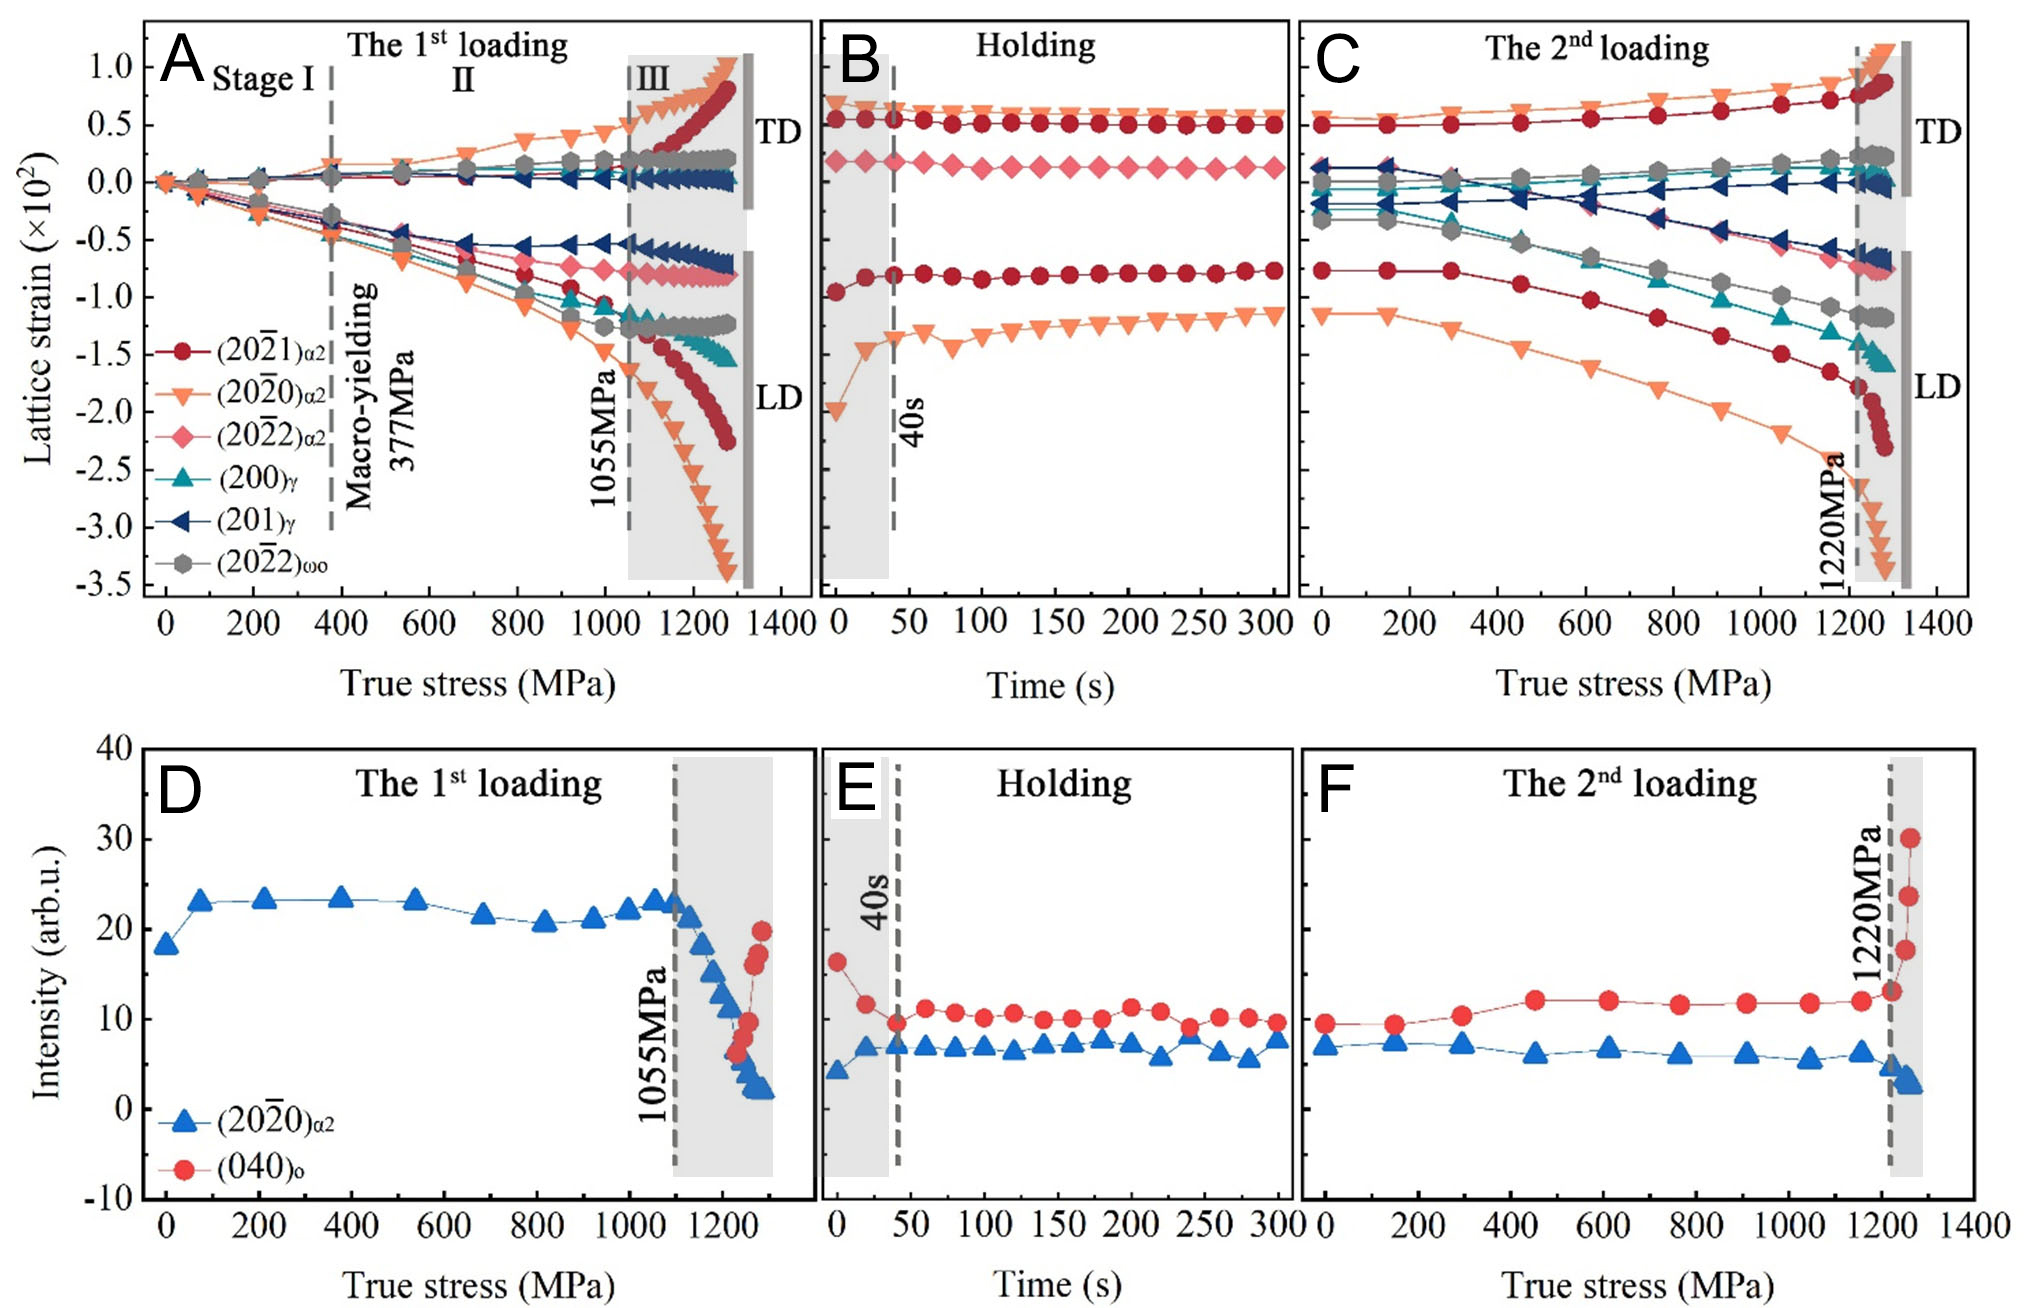
Figure 15. Lattice strain and intensity evolution in Ti-38Al-10Nb alloys subjected to double loading with an intermediate holding stage at 800 °C. (A) Lattice strain vs. true stress/holding time curves for α2 and γ reflections during the first loading; (B) Intensity vs. true stress curves for the (20


