


fig6
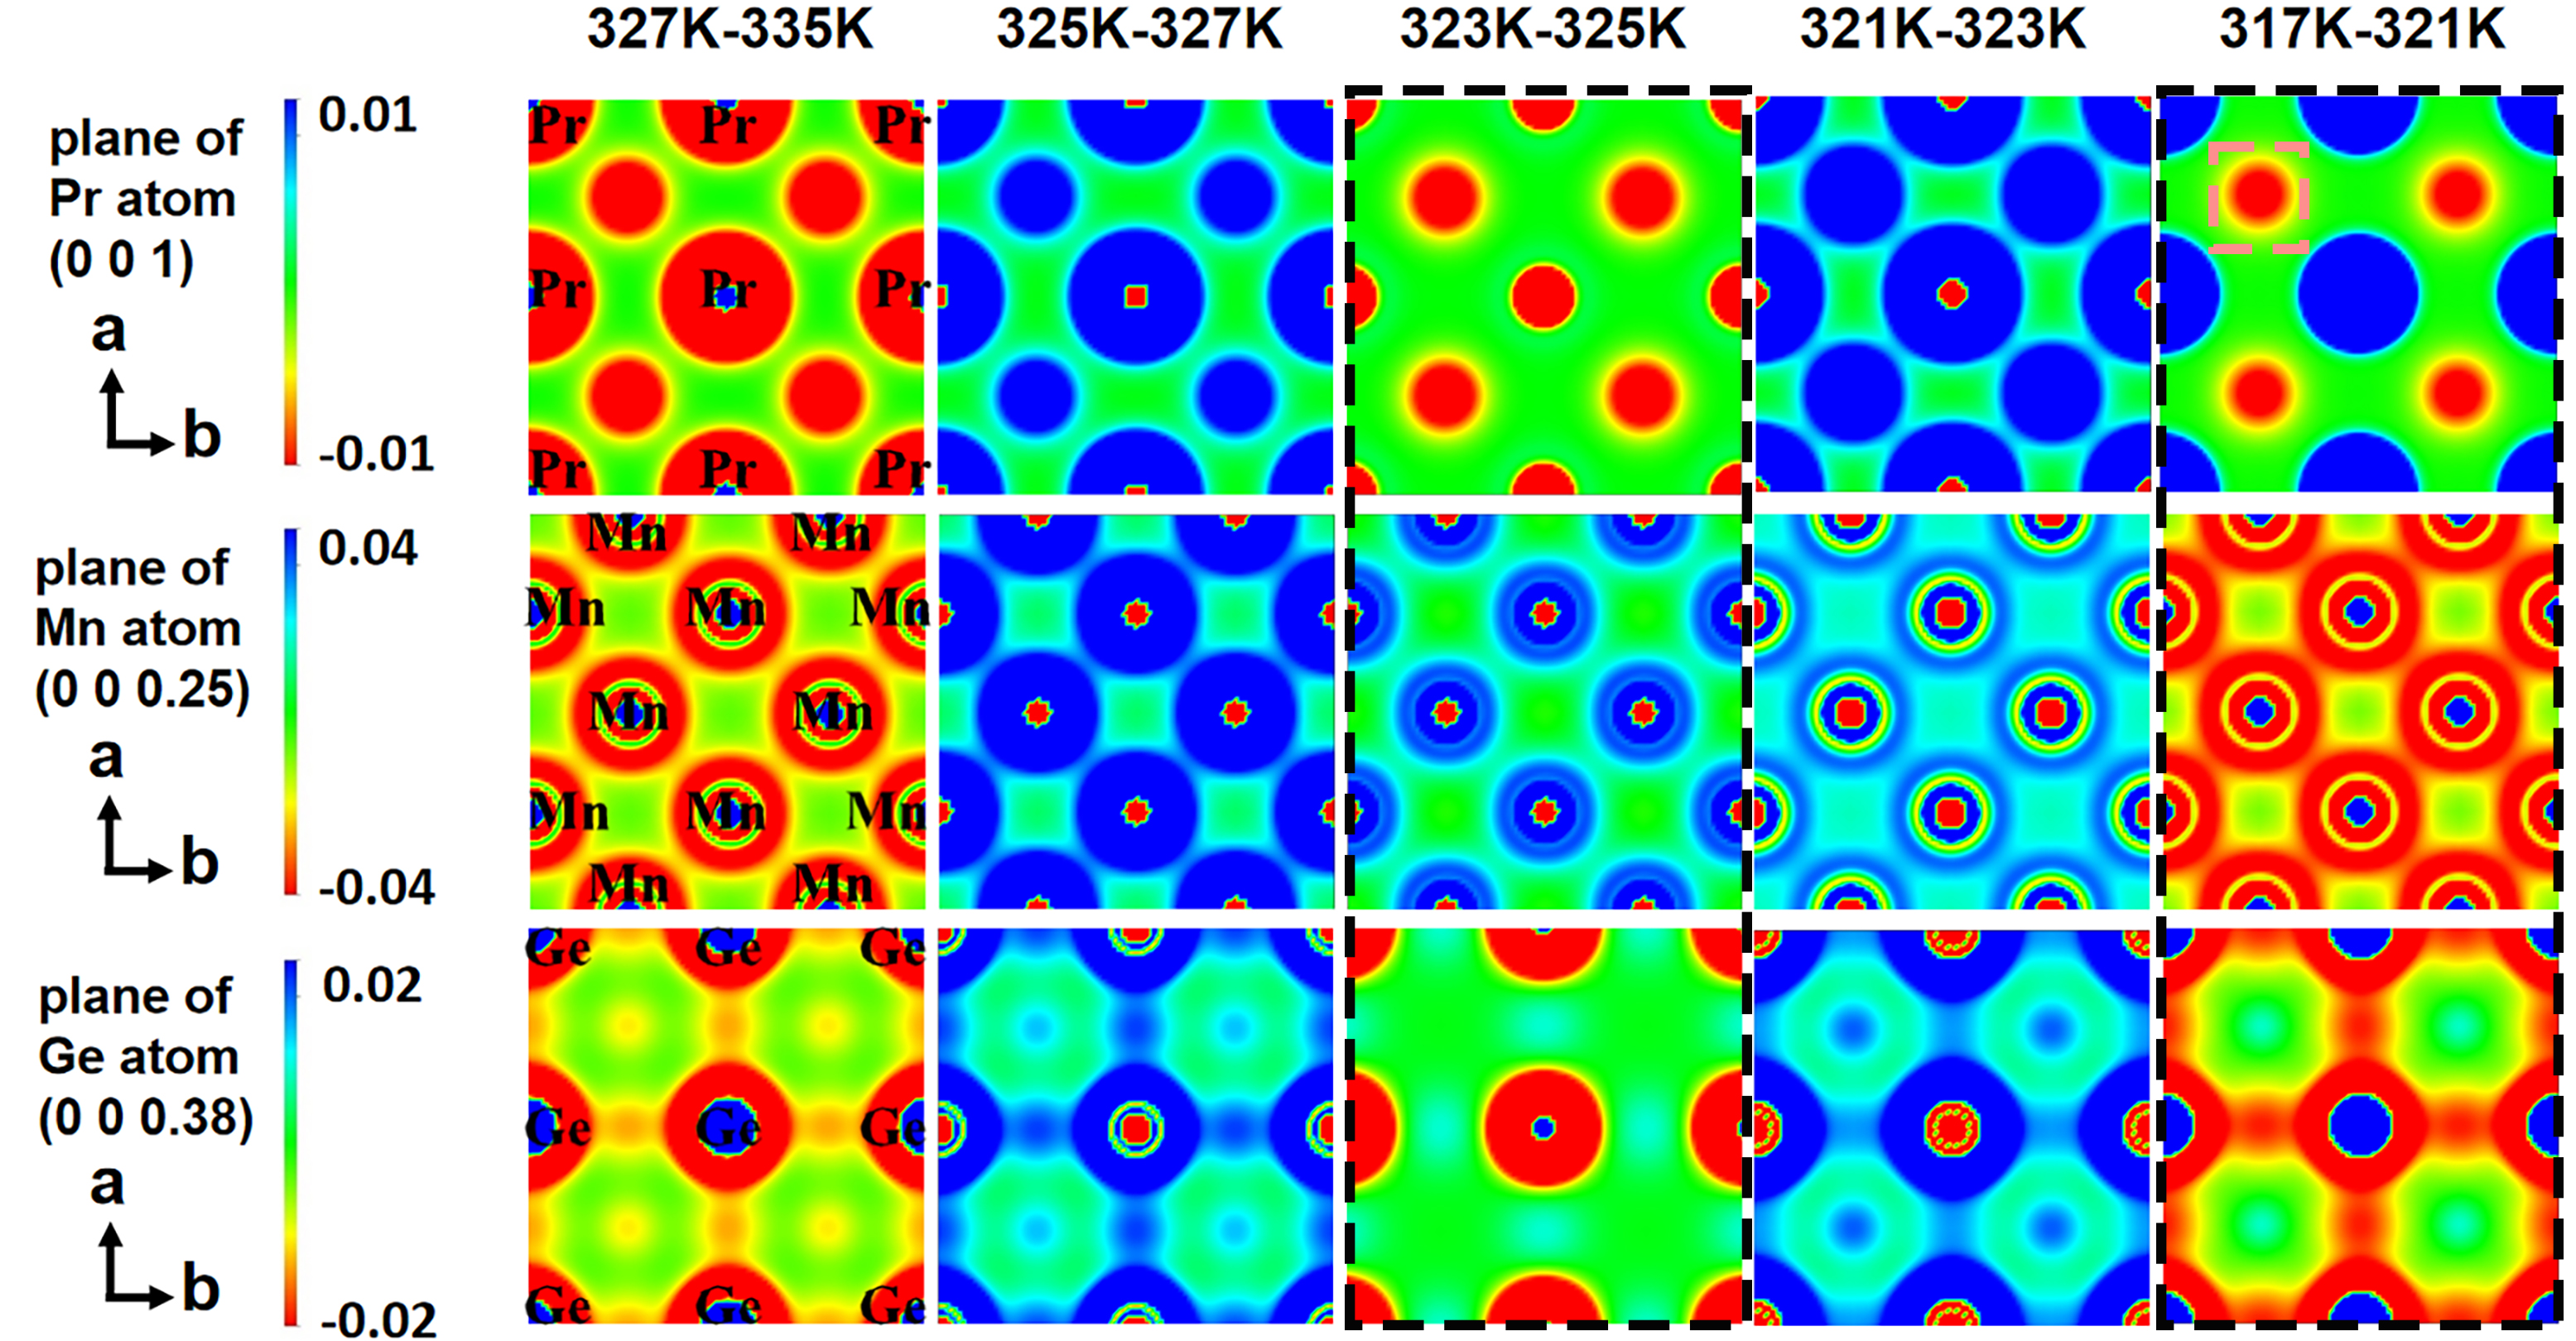
Figure 6. Temperature-dependent differential electron density mapping, (units: eÅ-3); the color scheme quantifies relative changes in electron density at (0 0 z) between reference temperature T1 (e.g., 327K) and comparison temperature T2 (e.g., 335K); regions exhibiting red hues indicate local electron depletion, signifying outward electron migration; conversely, blue regions demonstrate electron accumulation, reflecting inward electron redistribution.


