


fig5
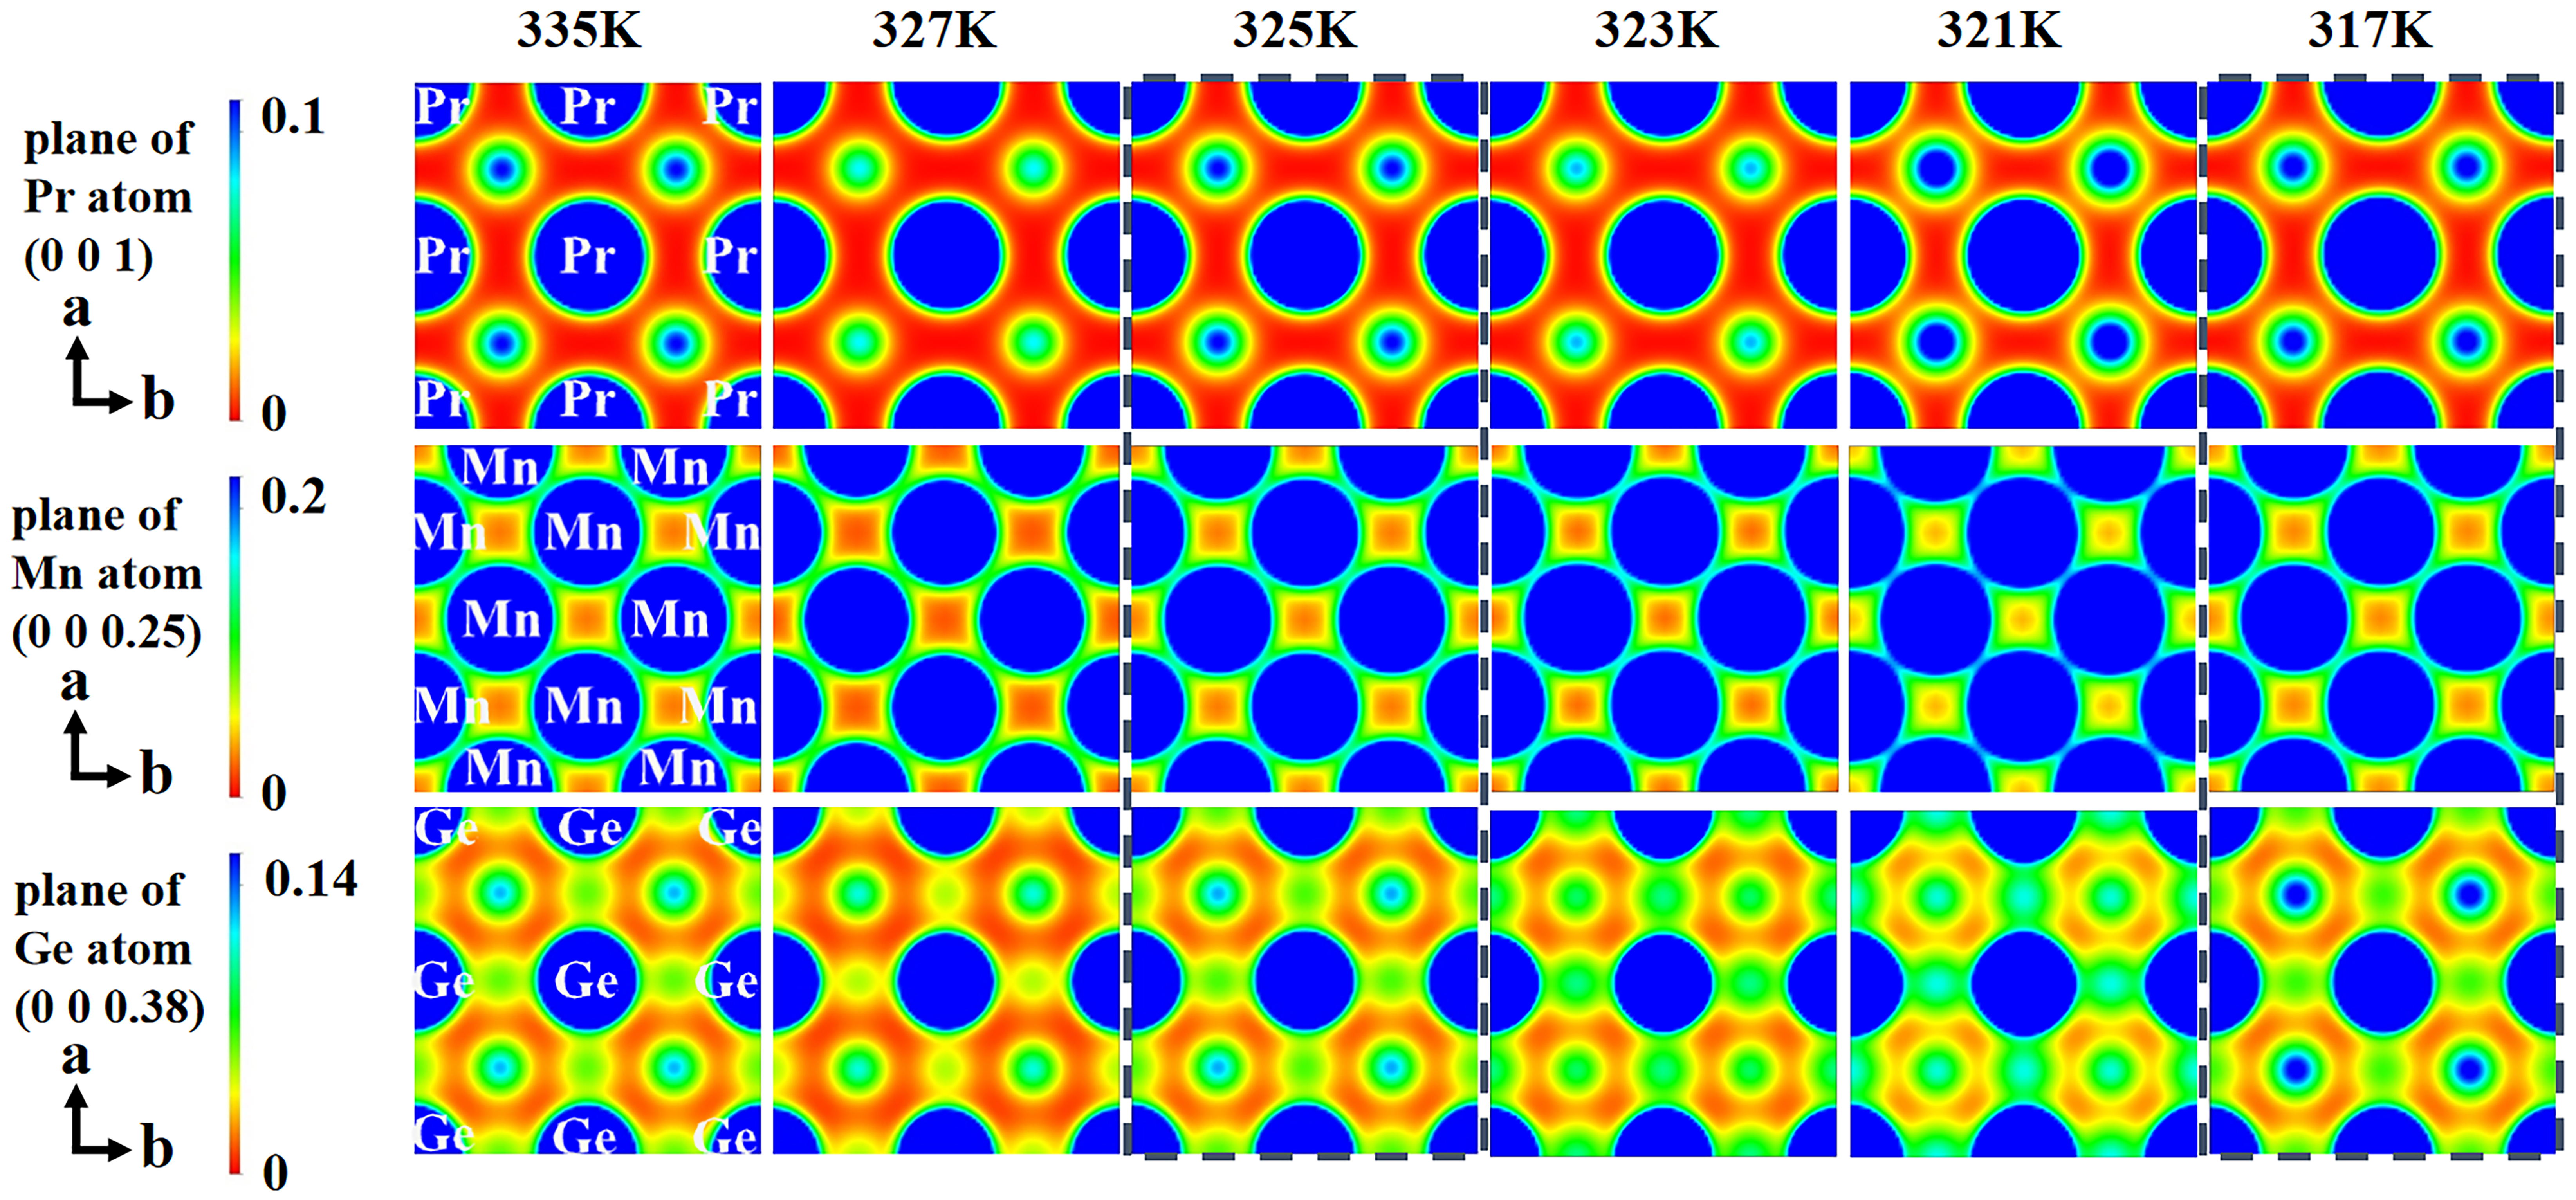
Figure 5. Evolution of electron density distribution (335-317 K); the unit is eÅ-3; isosurface plots on the (0 0 z) plane at l = z; red regions: electron density ≤ 0 eÅ-3, blue regions: electron density ≥ maximum scale value (see colorbar); color variations at fixed positions indicate electron density changes, blue shift (enhancement) versus red shift (depletion) relative to adjacent temperatures.


