


fig4
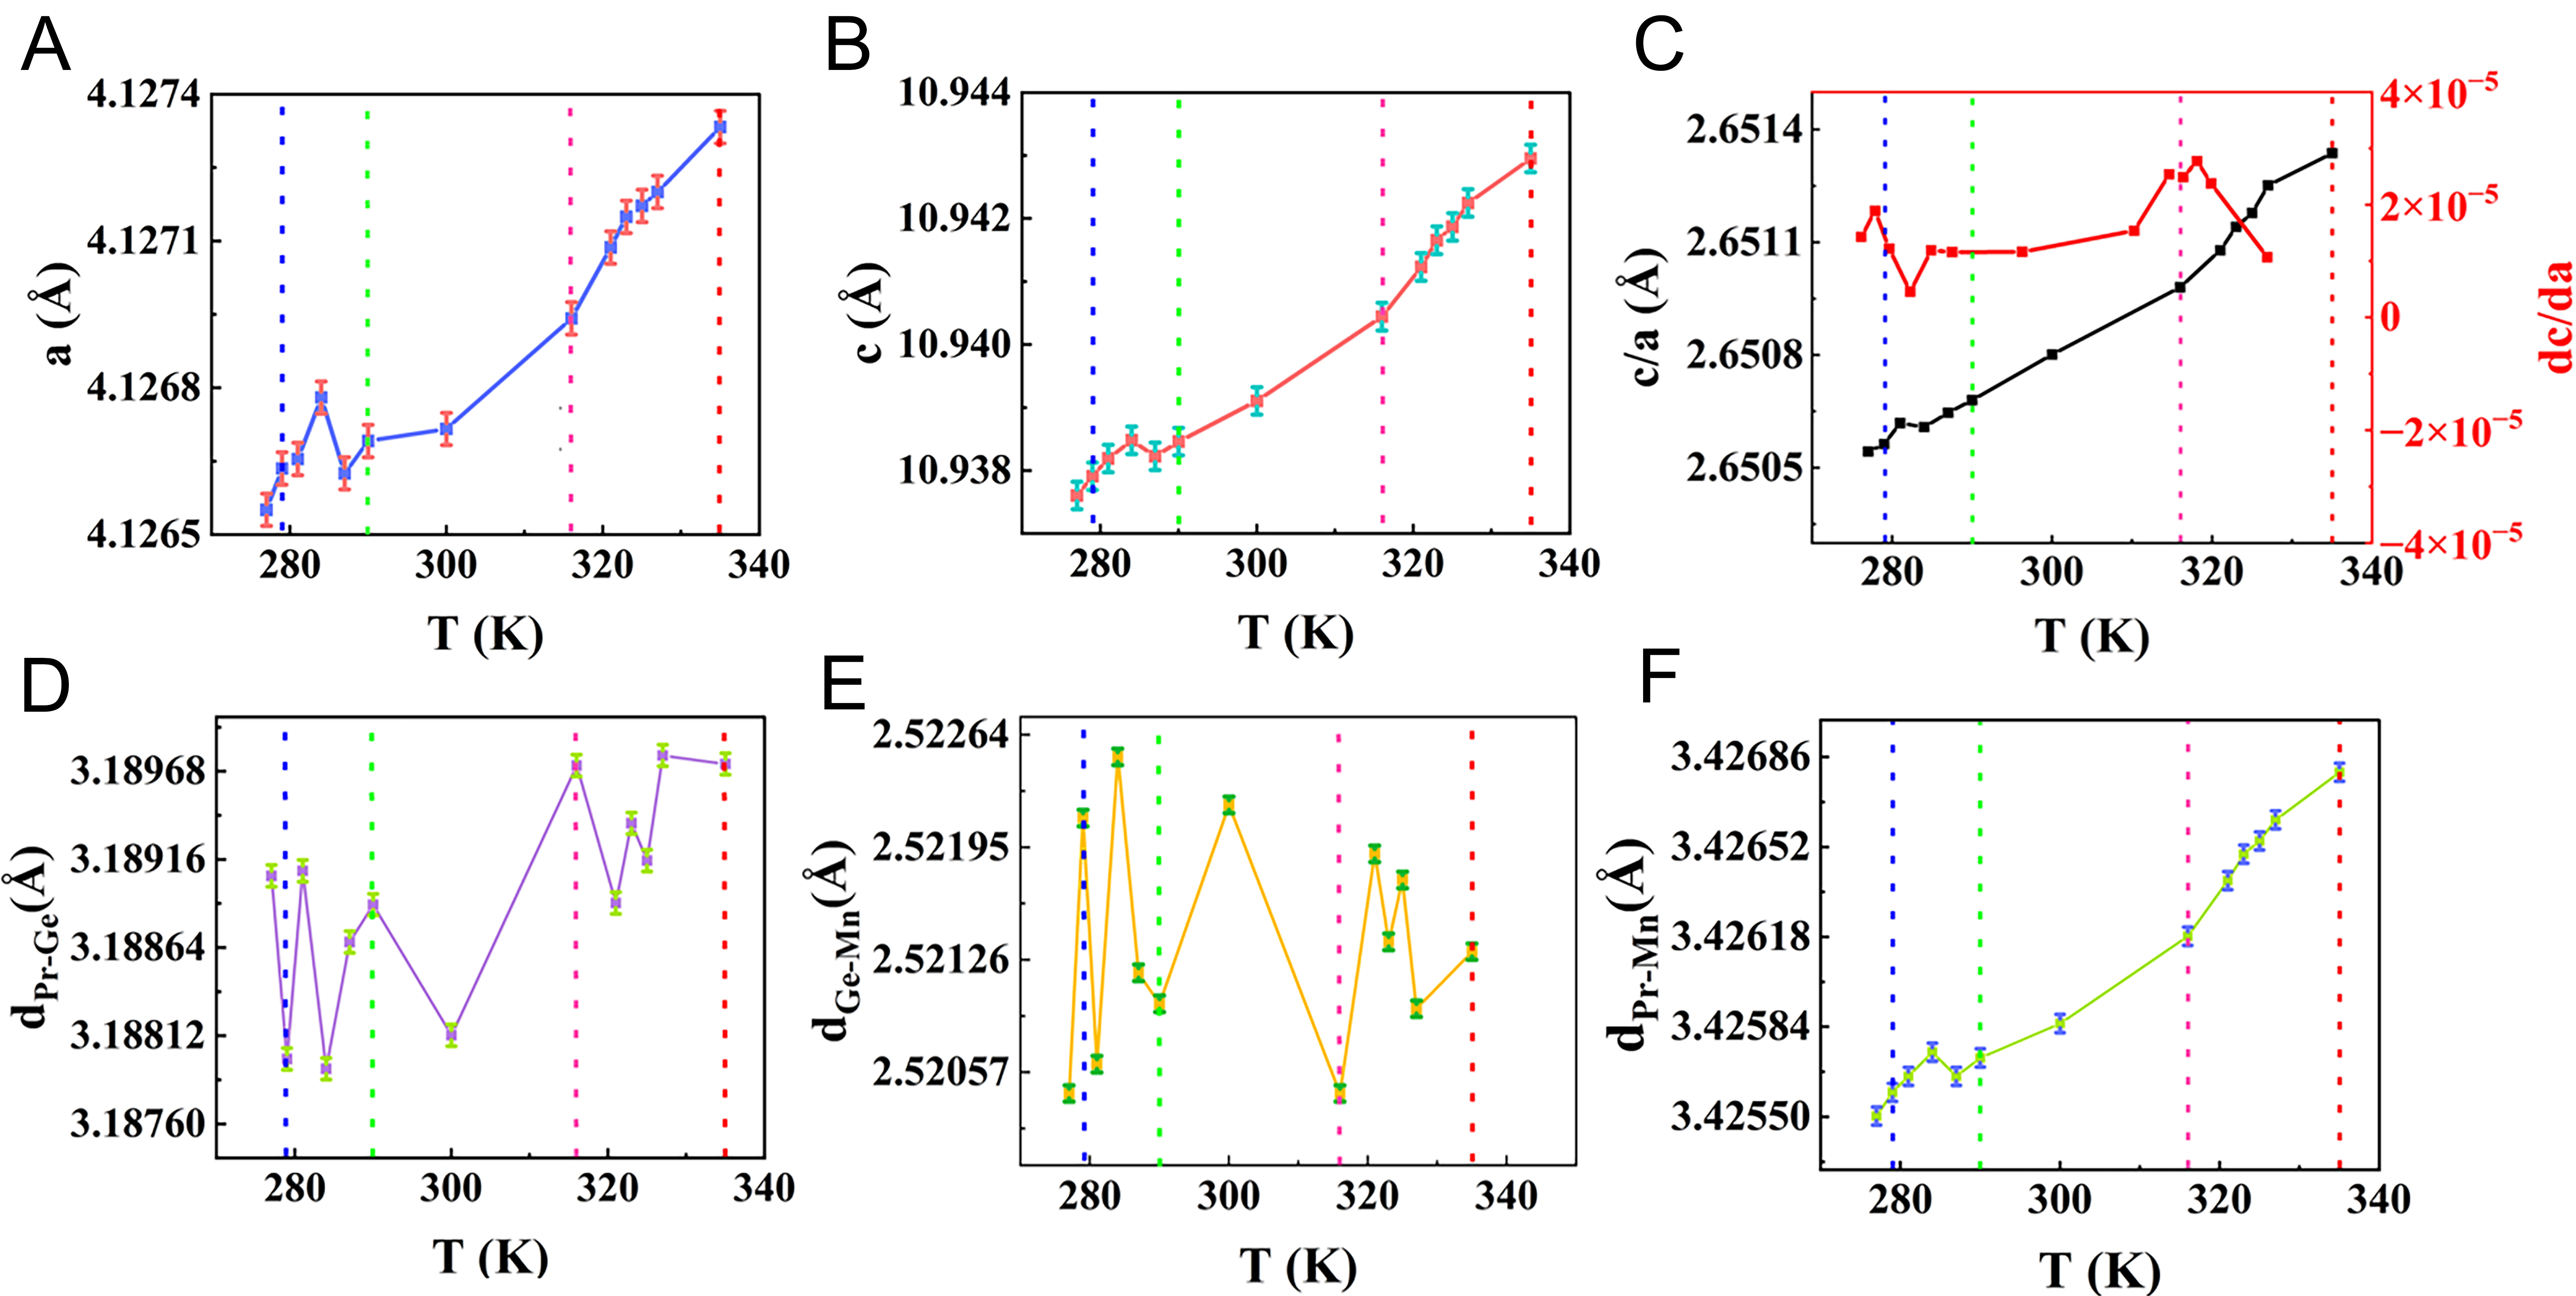
Figure 4. The variation in the lattice constant with temperature and the red, pink, green, and blue dotted lines correspond to the temperature points of 335, 317, 290 and 274 K, respectively. (A) the lattice constant a; (B) the lattice constant c; (C) the ratio of c-a (black) and the derivative of c-a (red) at different temperatures; (D) the distance between Pr-Ge along the c-axis; (E) the distance between adjacent Ge-Mn; (F) the distance between adjacent Pr-Mn.


