


fig3
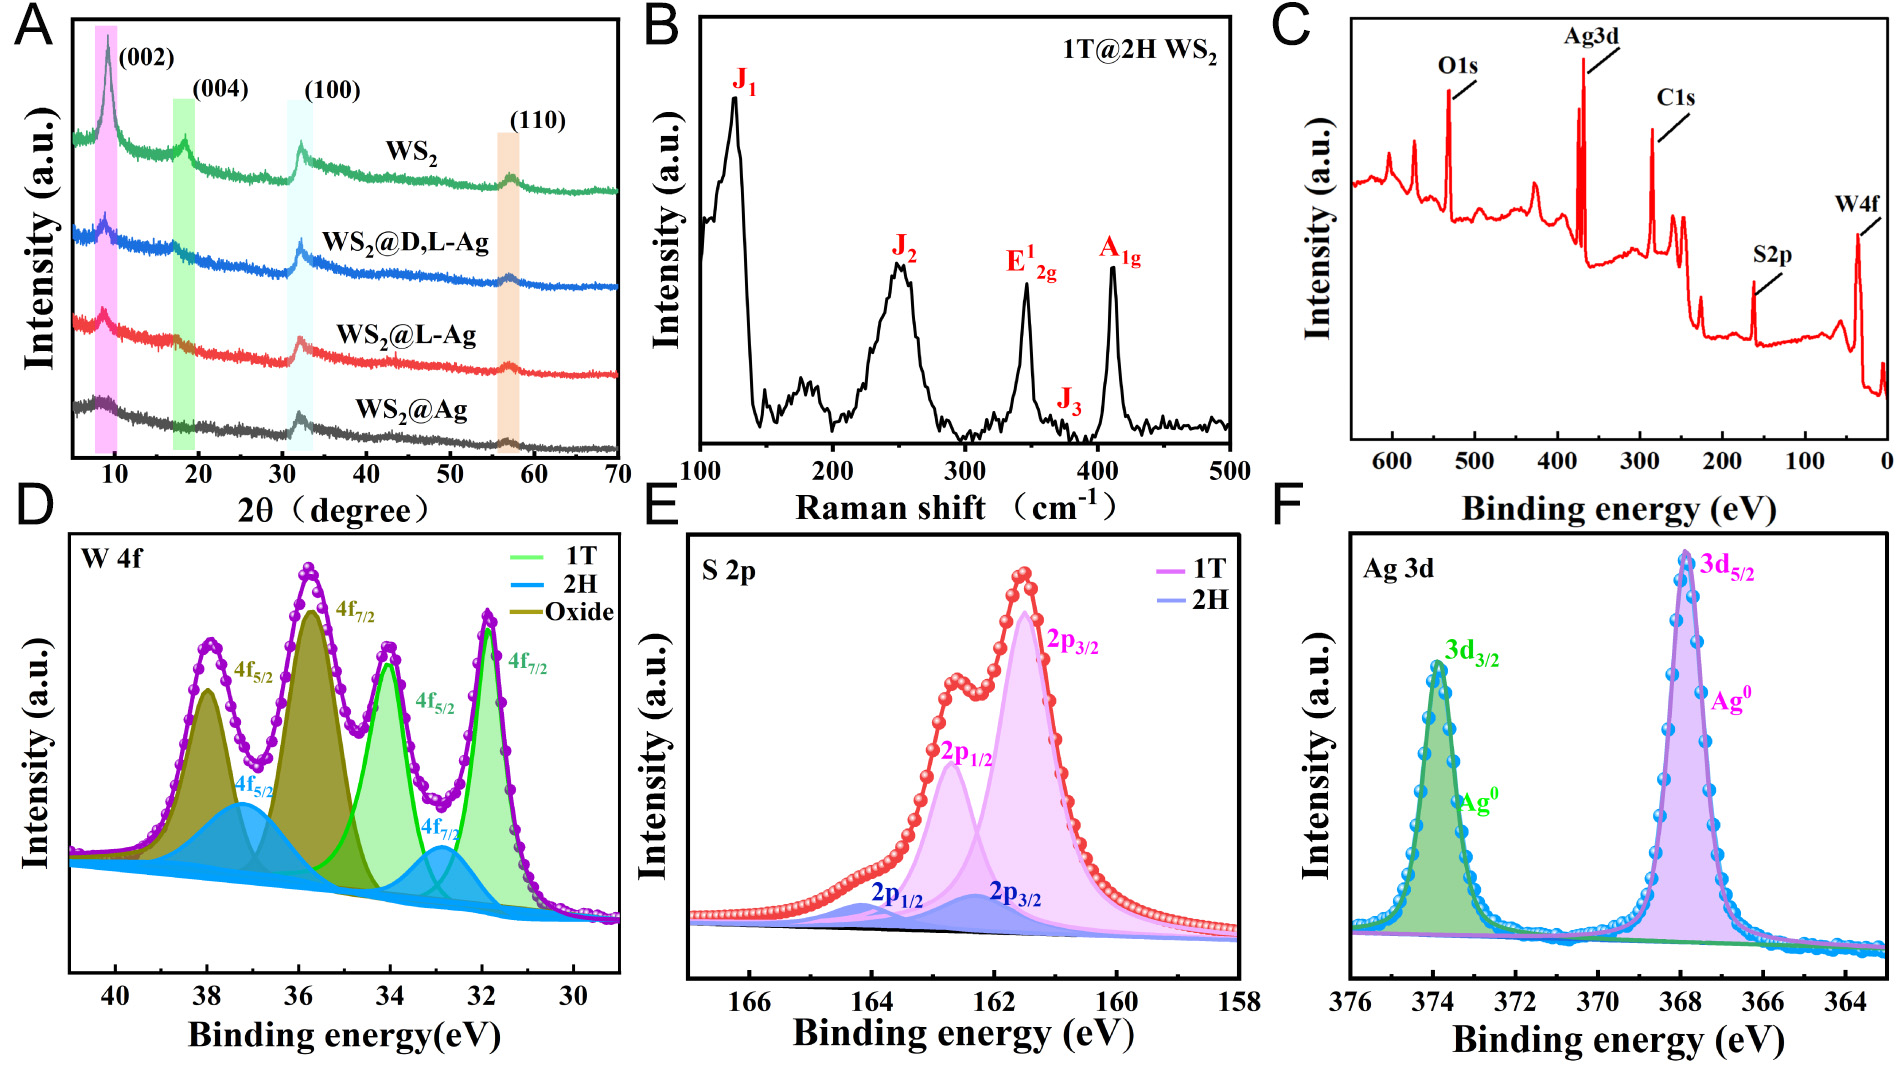
Figure 3. (A) XRD patterns of WS2, WS2@D-His/Ag, WS2@L-His/Ag, WS2@D,L-His/Ag, and WS2@Ag. (B) Raman spectra of WS2. (C) XPS survey spectrum and high-resolution XPS spectra of WS2@L-Ag High-resolution XPS spectra of WS2@L-Ag (D) W 4f, (E) S 2p, and (F) Ag 3d.


