


fig7
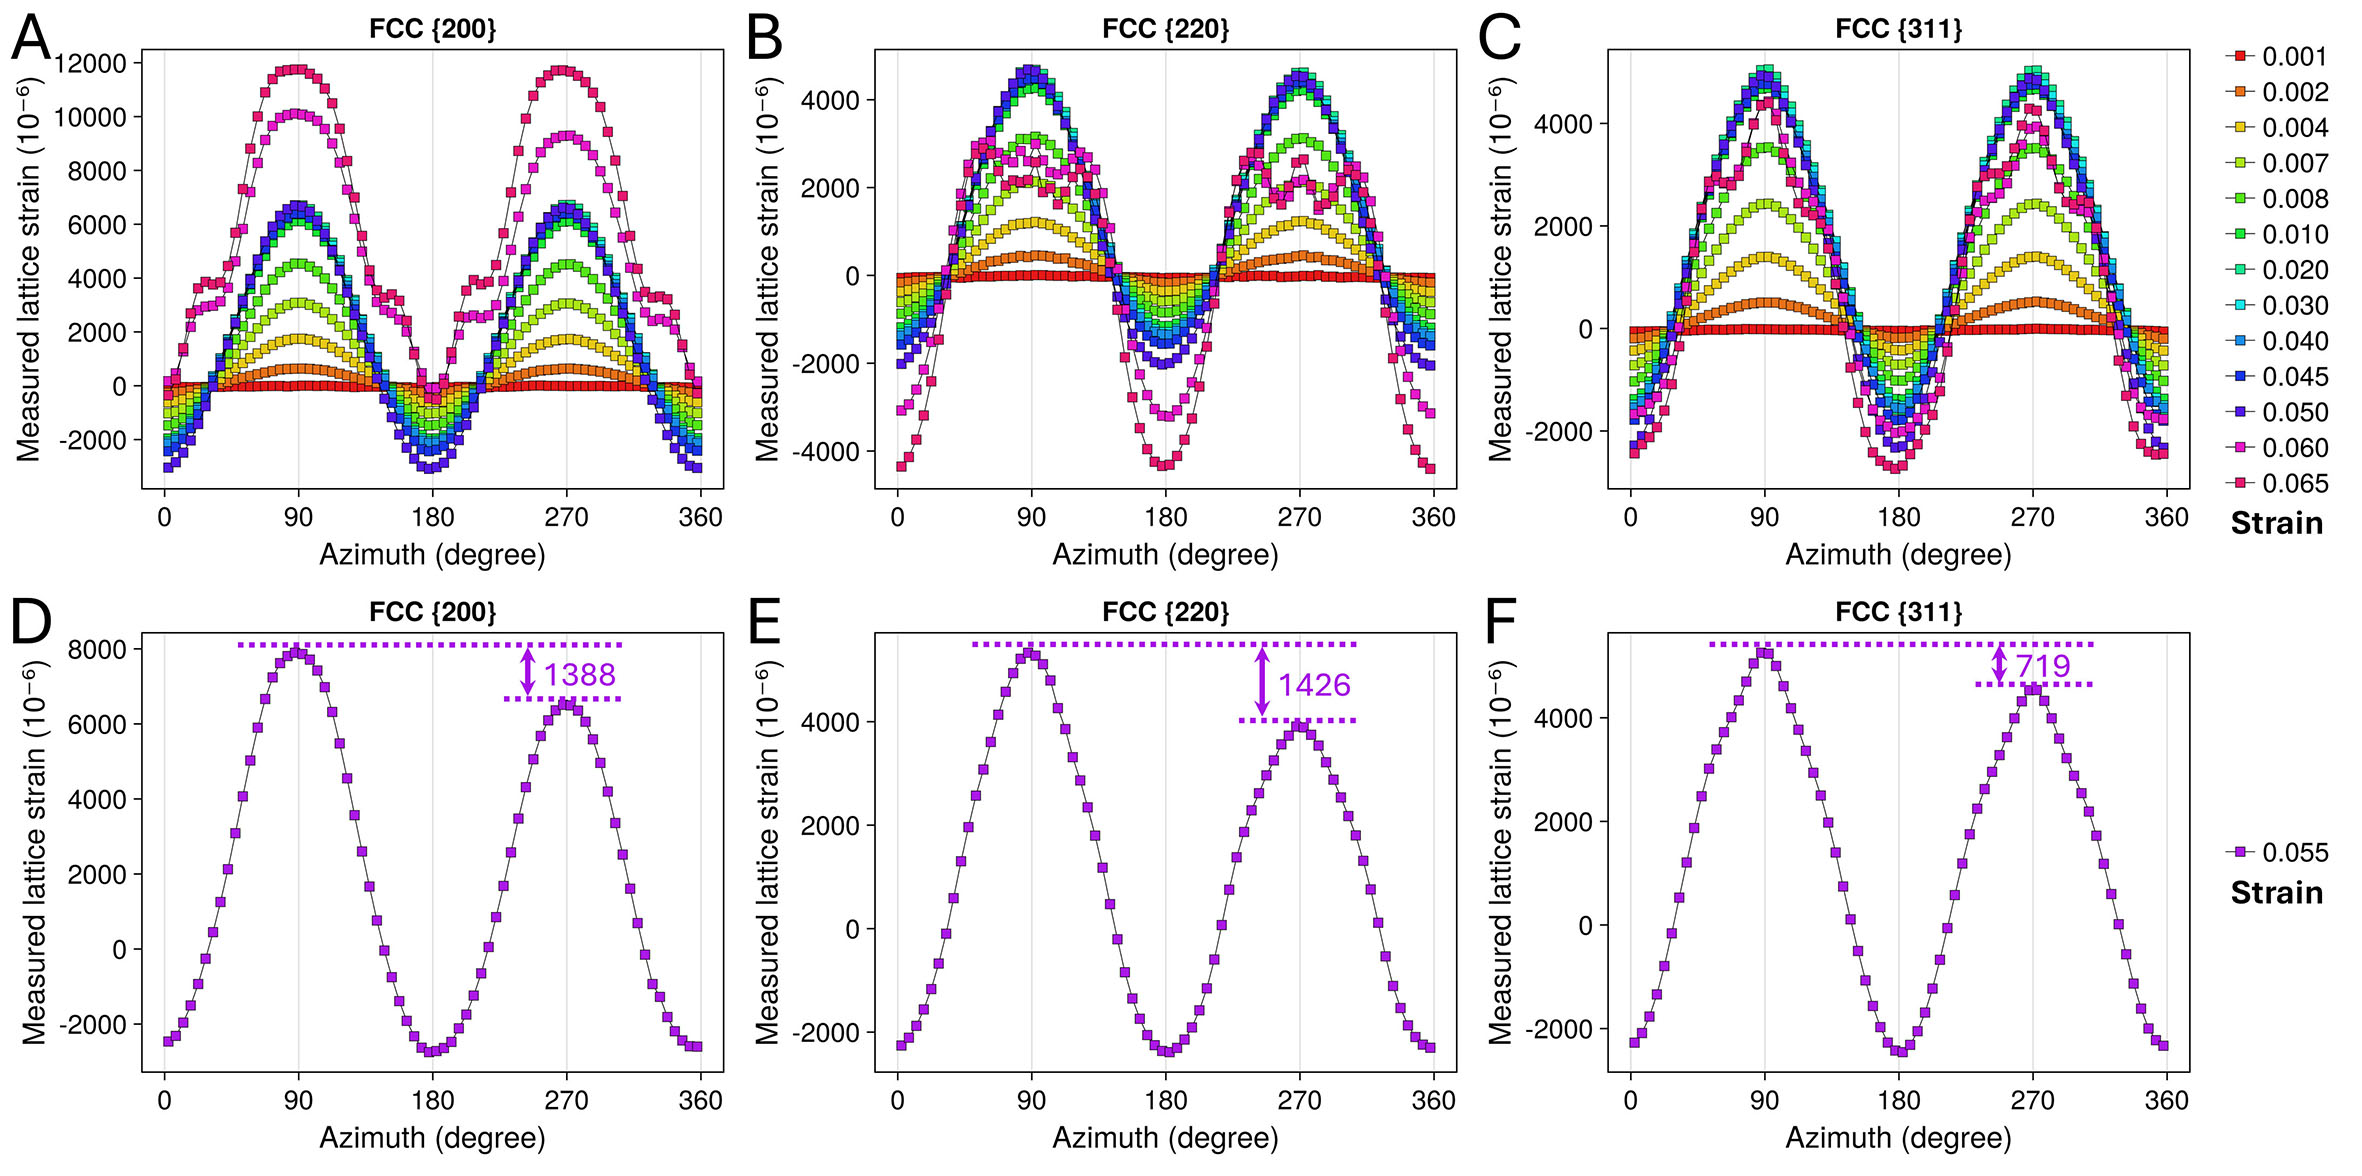
Figure 7. Measured lattice strain as a function of azimuth for the FCC γ phase. (A-C) Lattice strain data from a series of strain points beside 0.055. (D-F) Lattice strain data from the strain point of 0.055, where the
Figure 7. Measured lattice strain as a function of azimuth for the FCC γ phase. (A-C) Lattice strain data from a series of strain points beside 0.055. (D-F) Lattice strain data from the strain point of 0.055, where the


All published articles are preserved here permanently:
https://www.portico.org/publishers/oae/


