


fig4
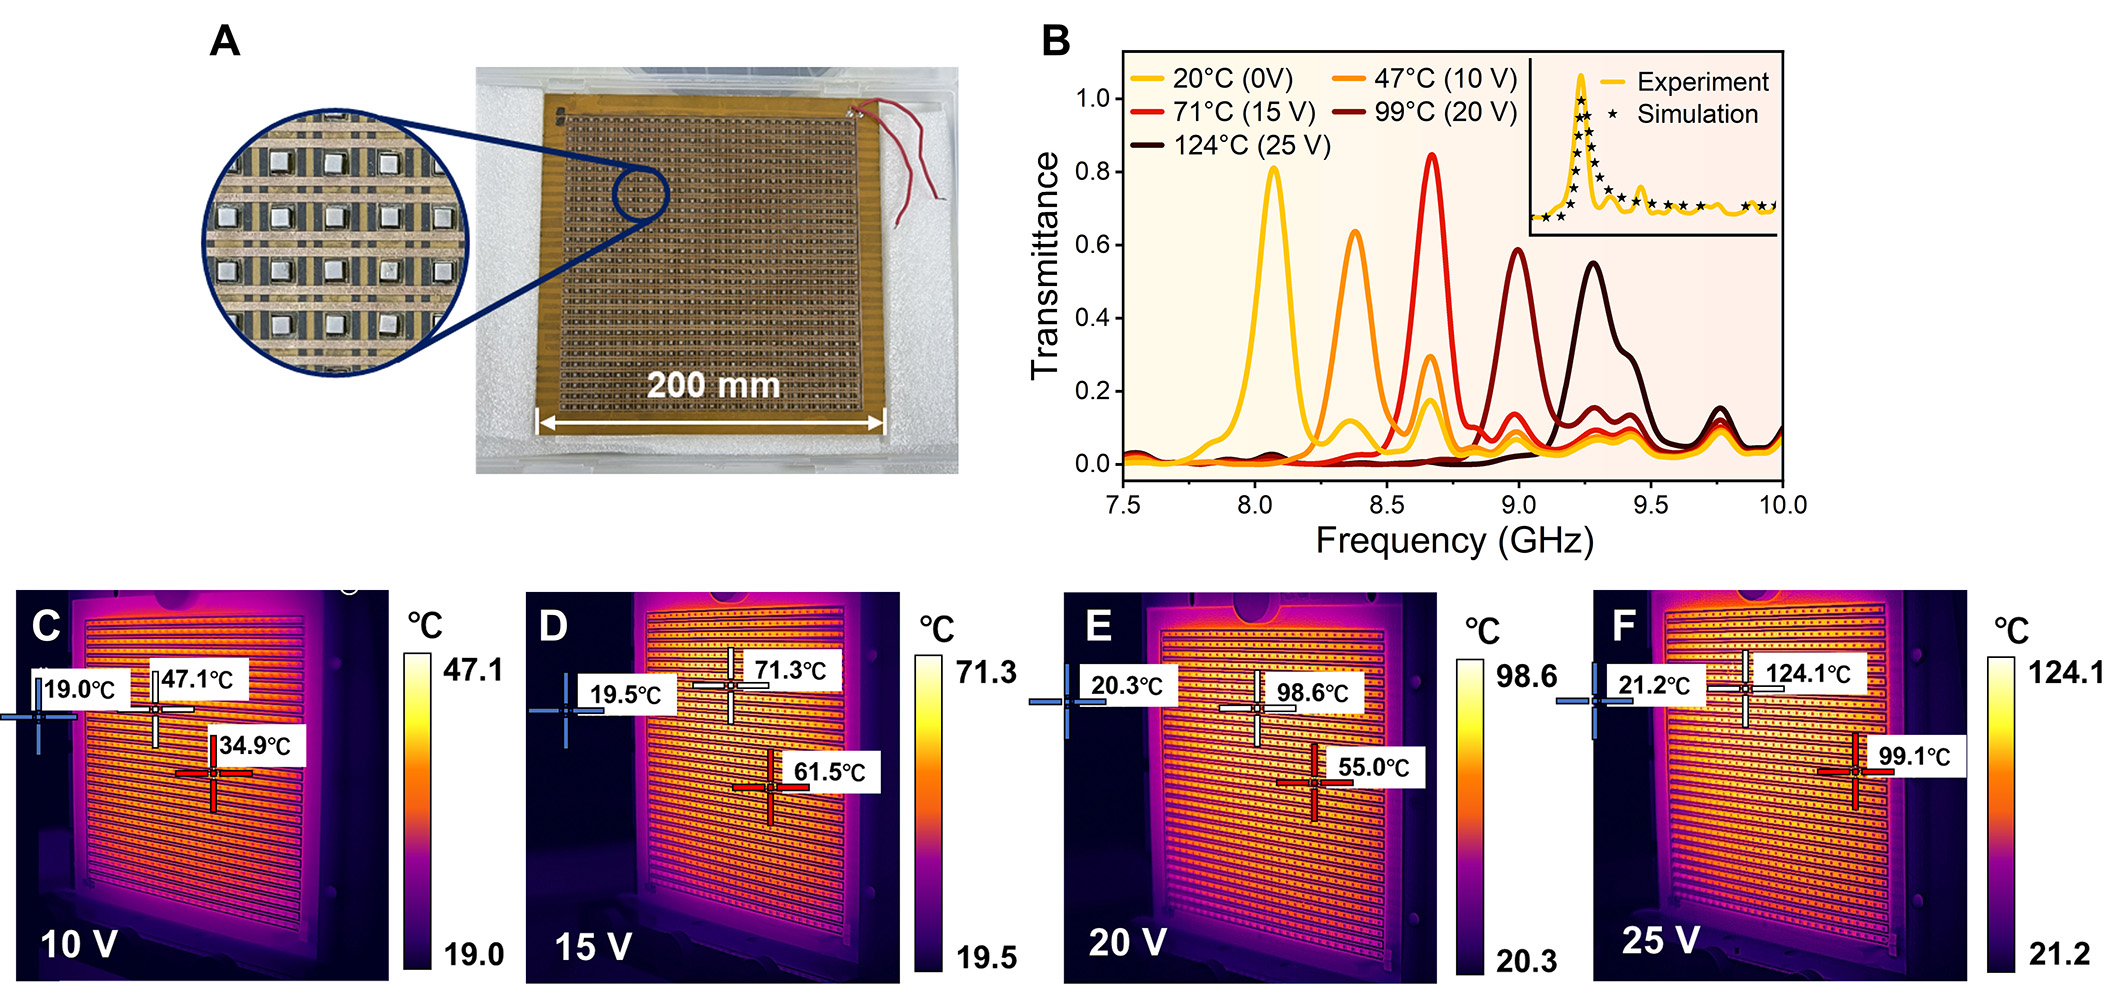
Figure 4. (A) Photograph of the metamaterial sample. (B) Demonstration of measured electrically tunable transmittance spectra at different temperatures (voltages). (Inset: consistent transmittance spectra of experimental results and simulation results at room temperature). Infrared thermography of the stabilized temperature field distribution under (C) 10 V, (D) 15 V, (E) 20 V, and (F) 25 V.


