


fig3
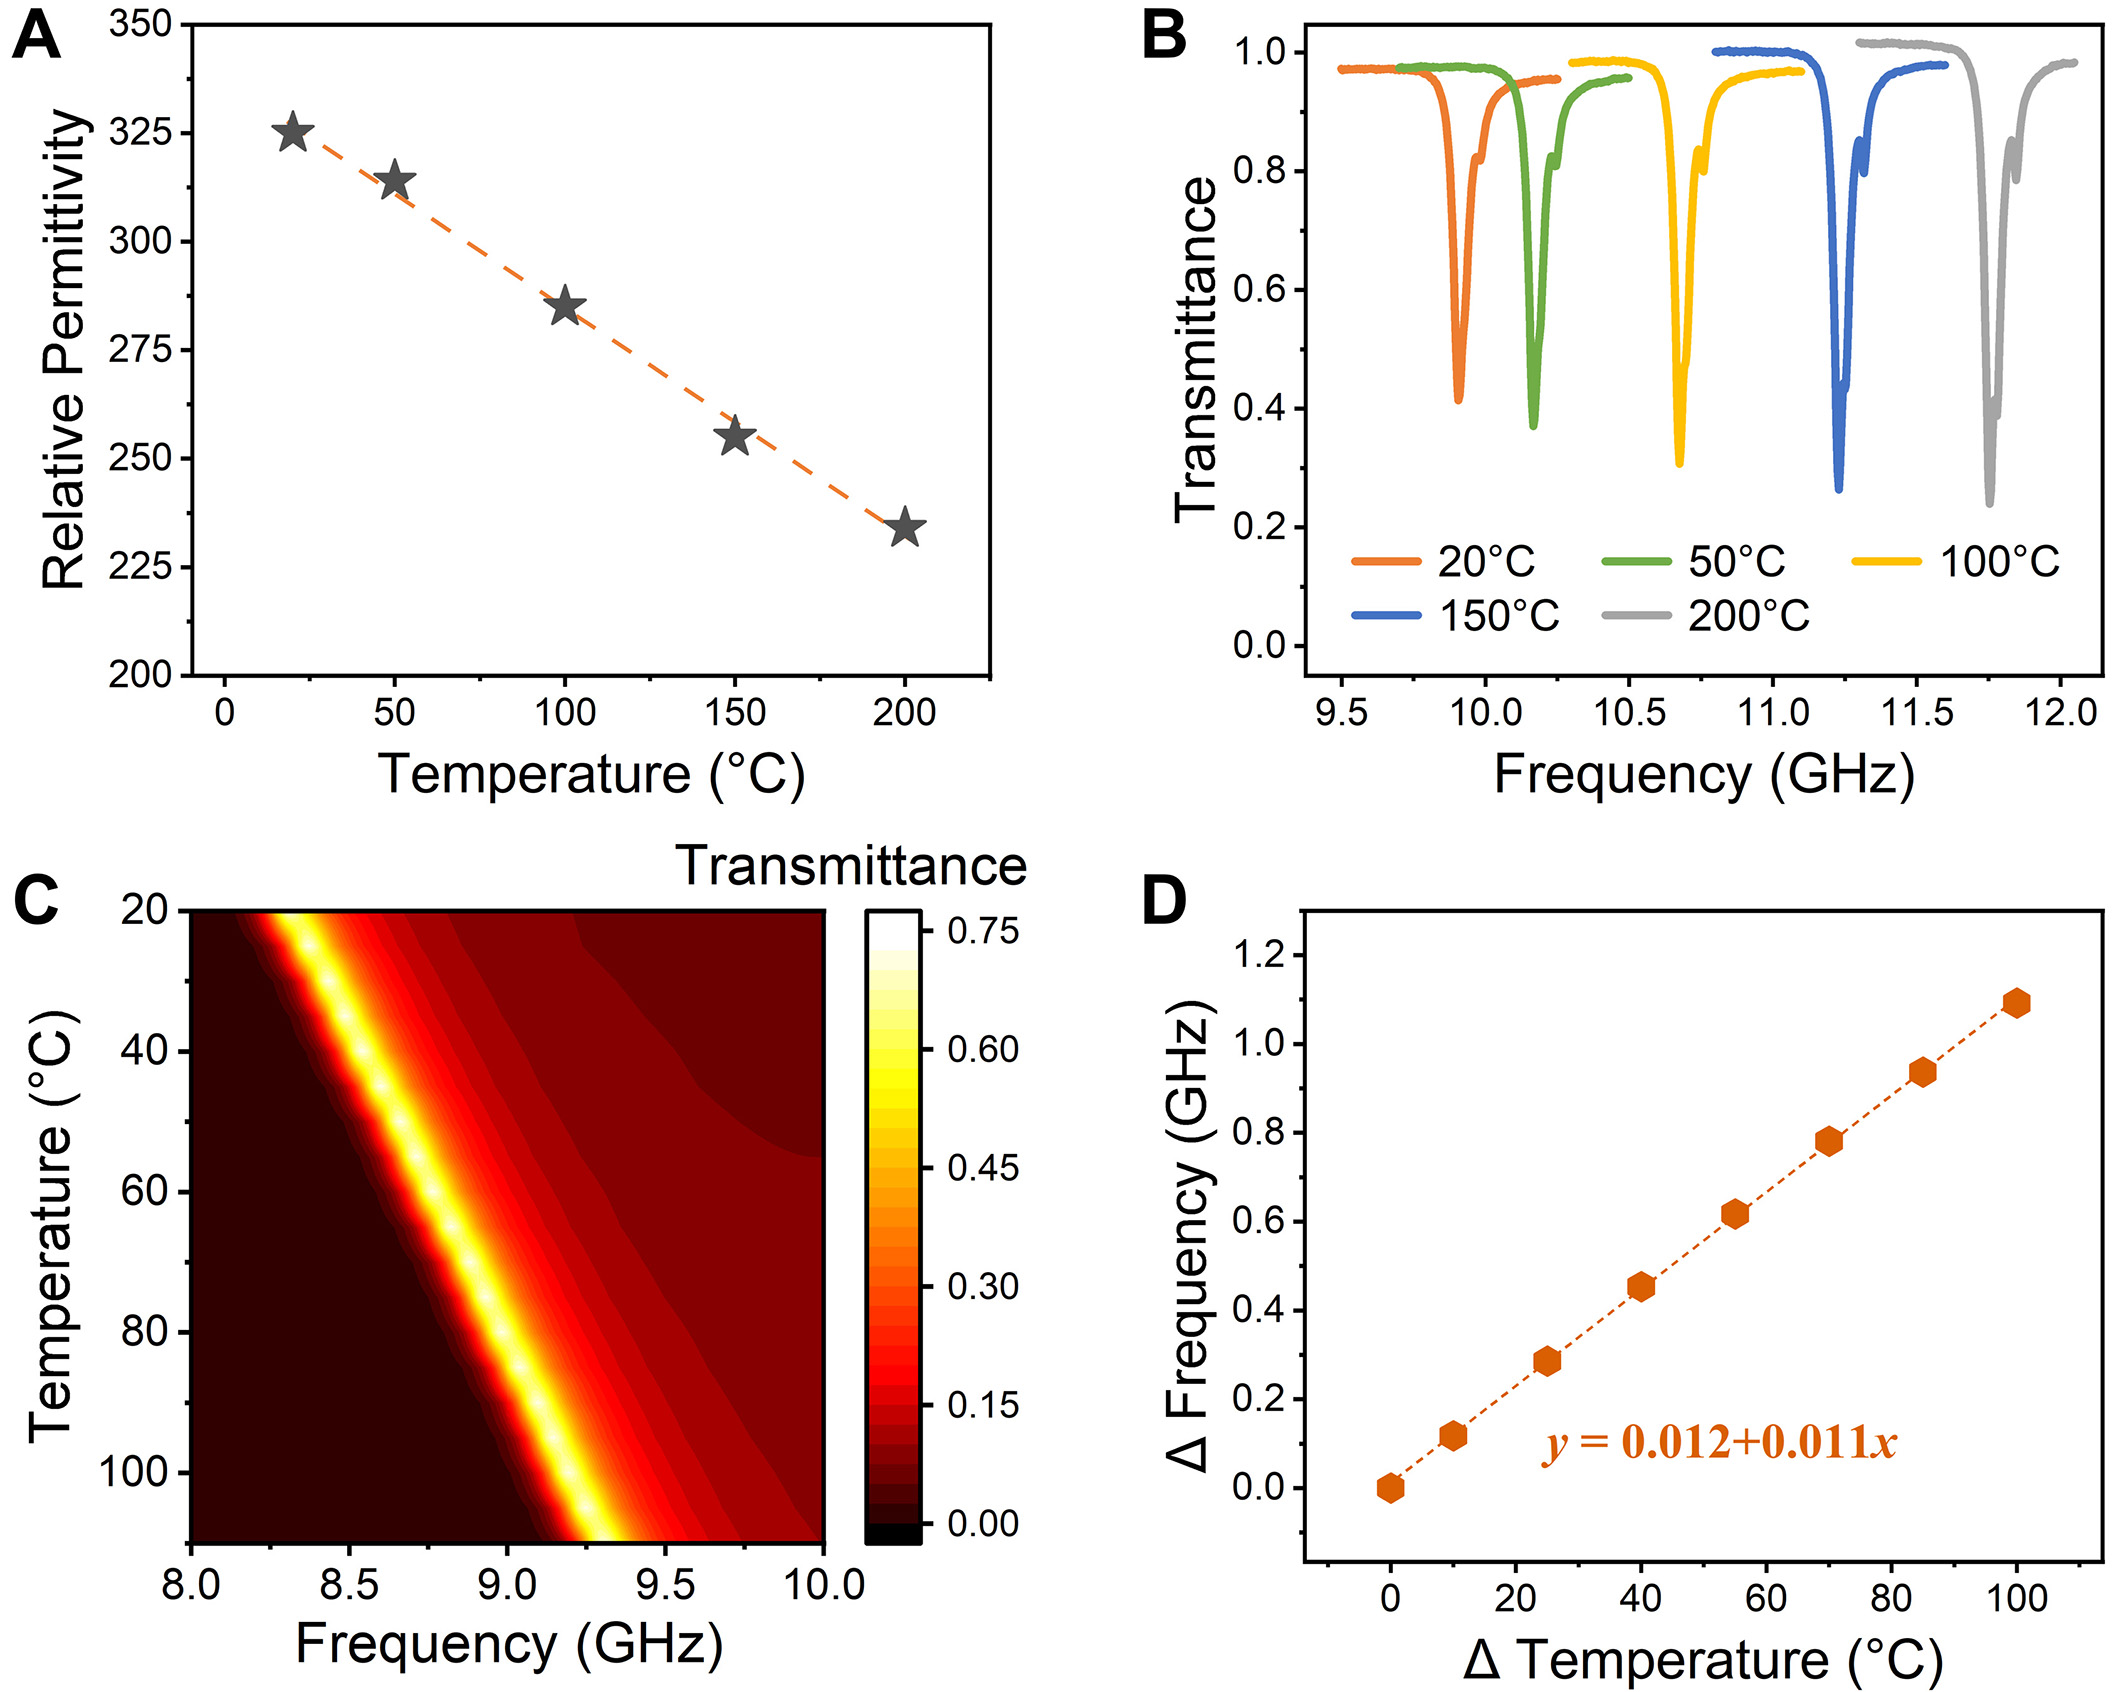
Figure 3. (A) Dependence of measured relative permittivity of SrTiO3 on different temperatures. (B) Measured transmittance spectra of the SrTiO3 particle array with the size of 2.4 mm × 2.4 mm × 2.9 mm. (C) Simulation transmittance of the metamaterial with temperature changing from 20 to 120 °C. (D) Simulation transmission peak frequency shift range (ΔFrequency) with the increment of temperature (ΔTemperature) and corresponding curve fitting results (dashed line).


