


fig5
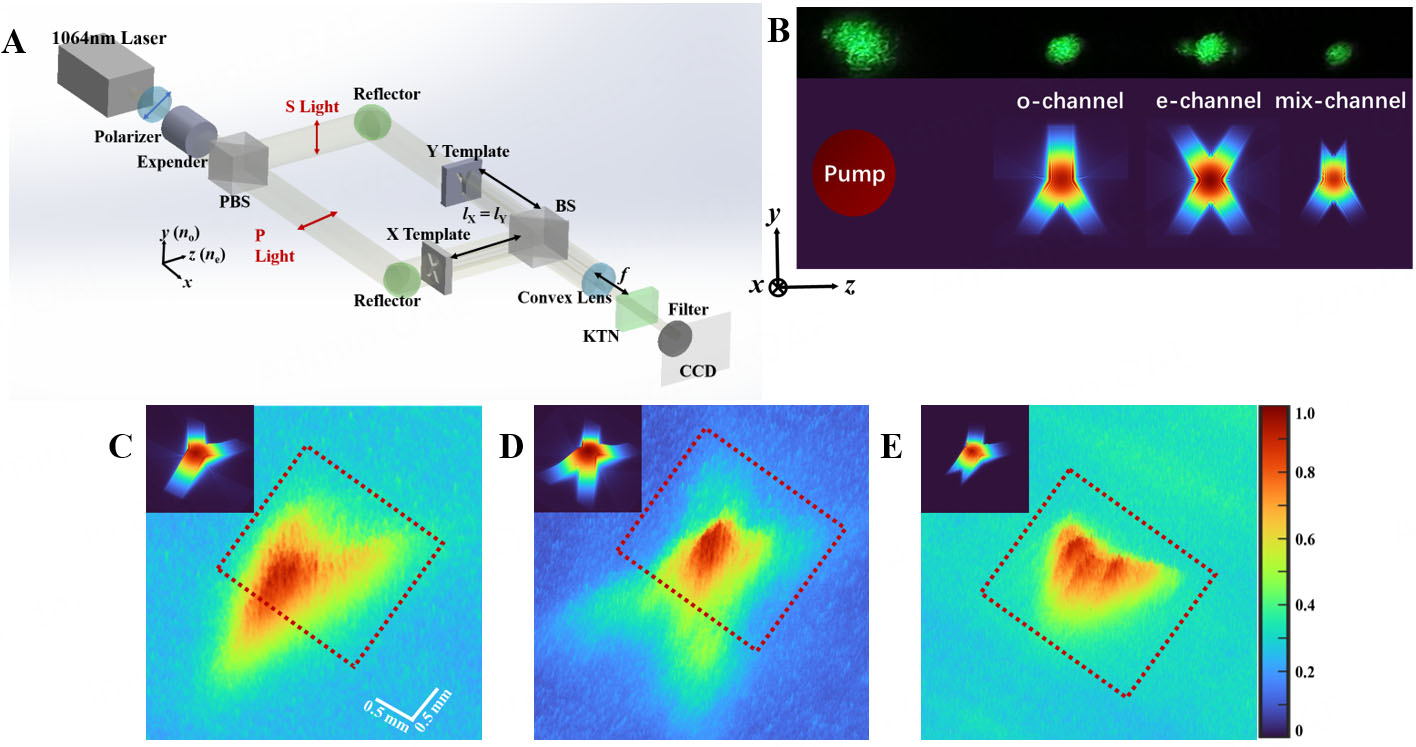
Figure 5. (A) A diagram of multi-channel nonlinear image propagation. (B) Simulated two-dimensional SHG distribution of the o-channel (oo → e), e-channel (ee → e), and mix-channel (oe → o) at the CCD receiving plane; the inversion of the image is due to the effect of the lens. The insert shows an experimentally measured SHG distribution pattern (one side), generated by a 45°-polarized 1,064 nm laser propagating through the optical setup shown in Figure 1C. Real distribution of (C) o-channel, (D) e-channel, and (E) mix-channel. The inserts show the corresponding simulated results, and the area within the red box represents the overlapping region of “X” and “Y” images. (B-E) shares a common color bar.


