


fig1
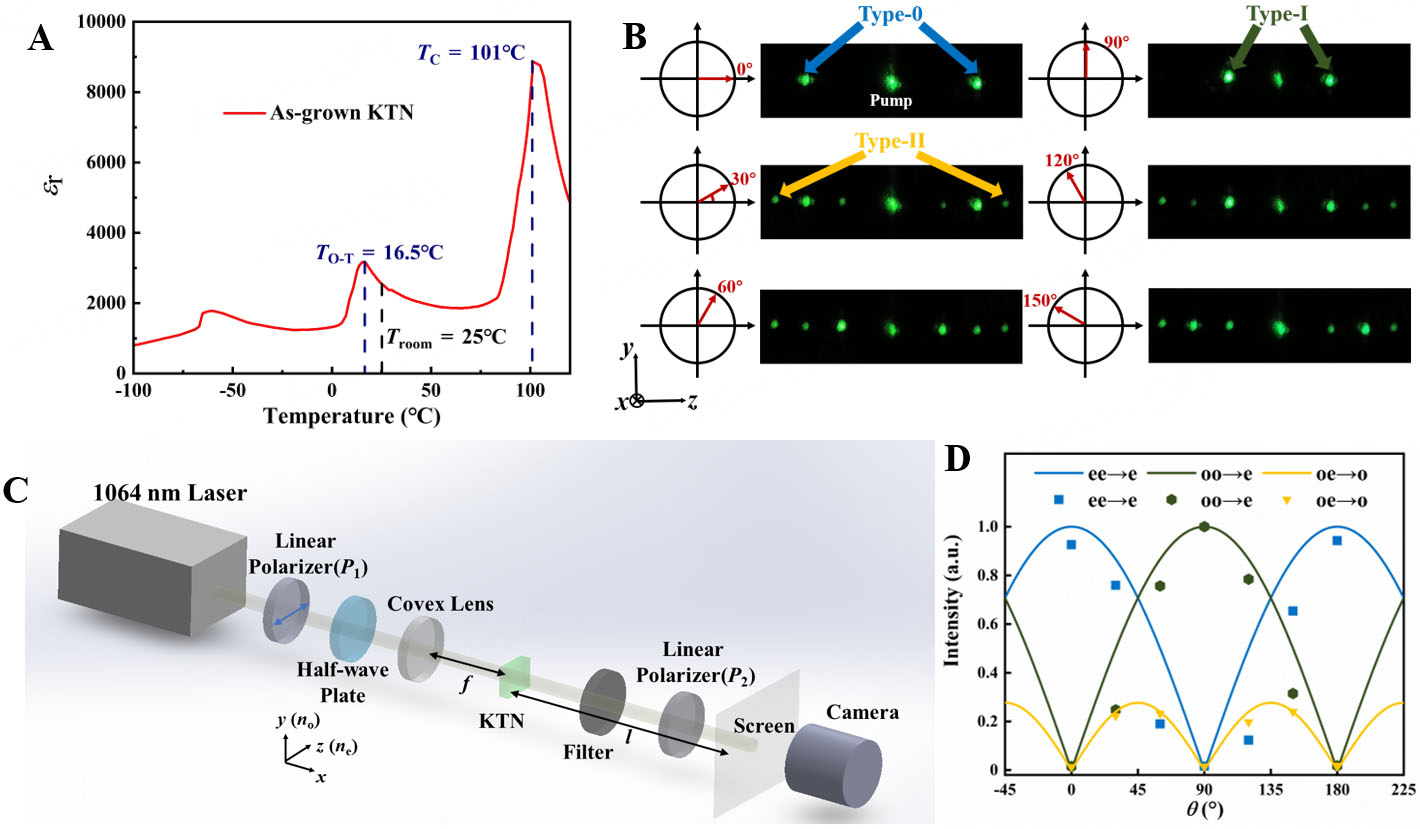
Figure 1. (A) The relative dielectric permittivity (εr) vs. temperature at 1 kHz. TO-T: the orthorhombic-to-tetragonal phase transition temperature; Troom: the room temperature; TC: Curie temperature, the tetragonal-to-cubic phase transition temperature. (B) Different polarization states (left) of the fundamental light incident along the x-axis and the corresponding SHG spots (right). (C) Optical path diagram for investigating the polarization dependence of SHG. (D) Relative intensity of SHG spots in different polarization states.


