


fig9
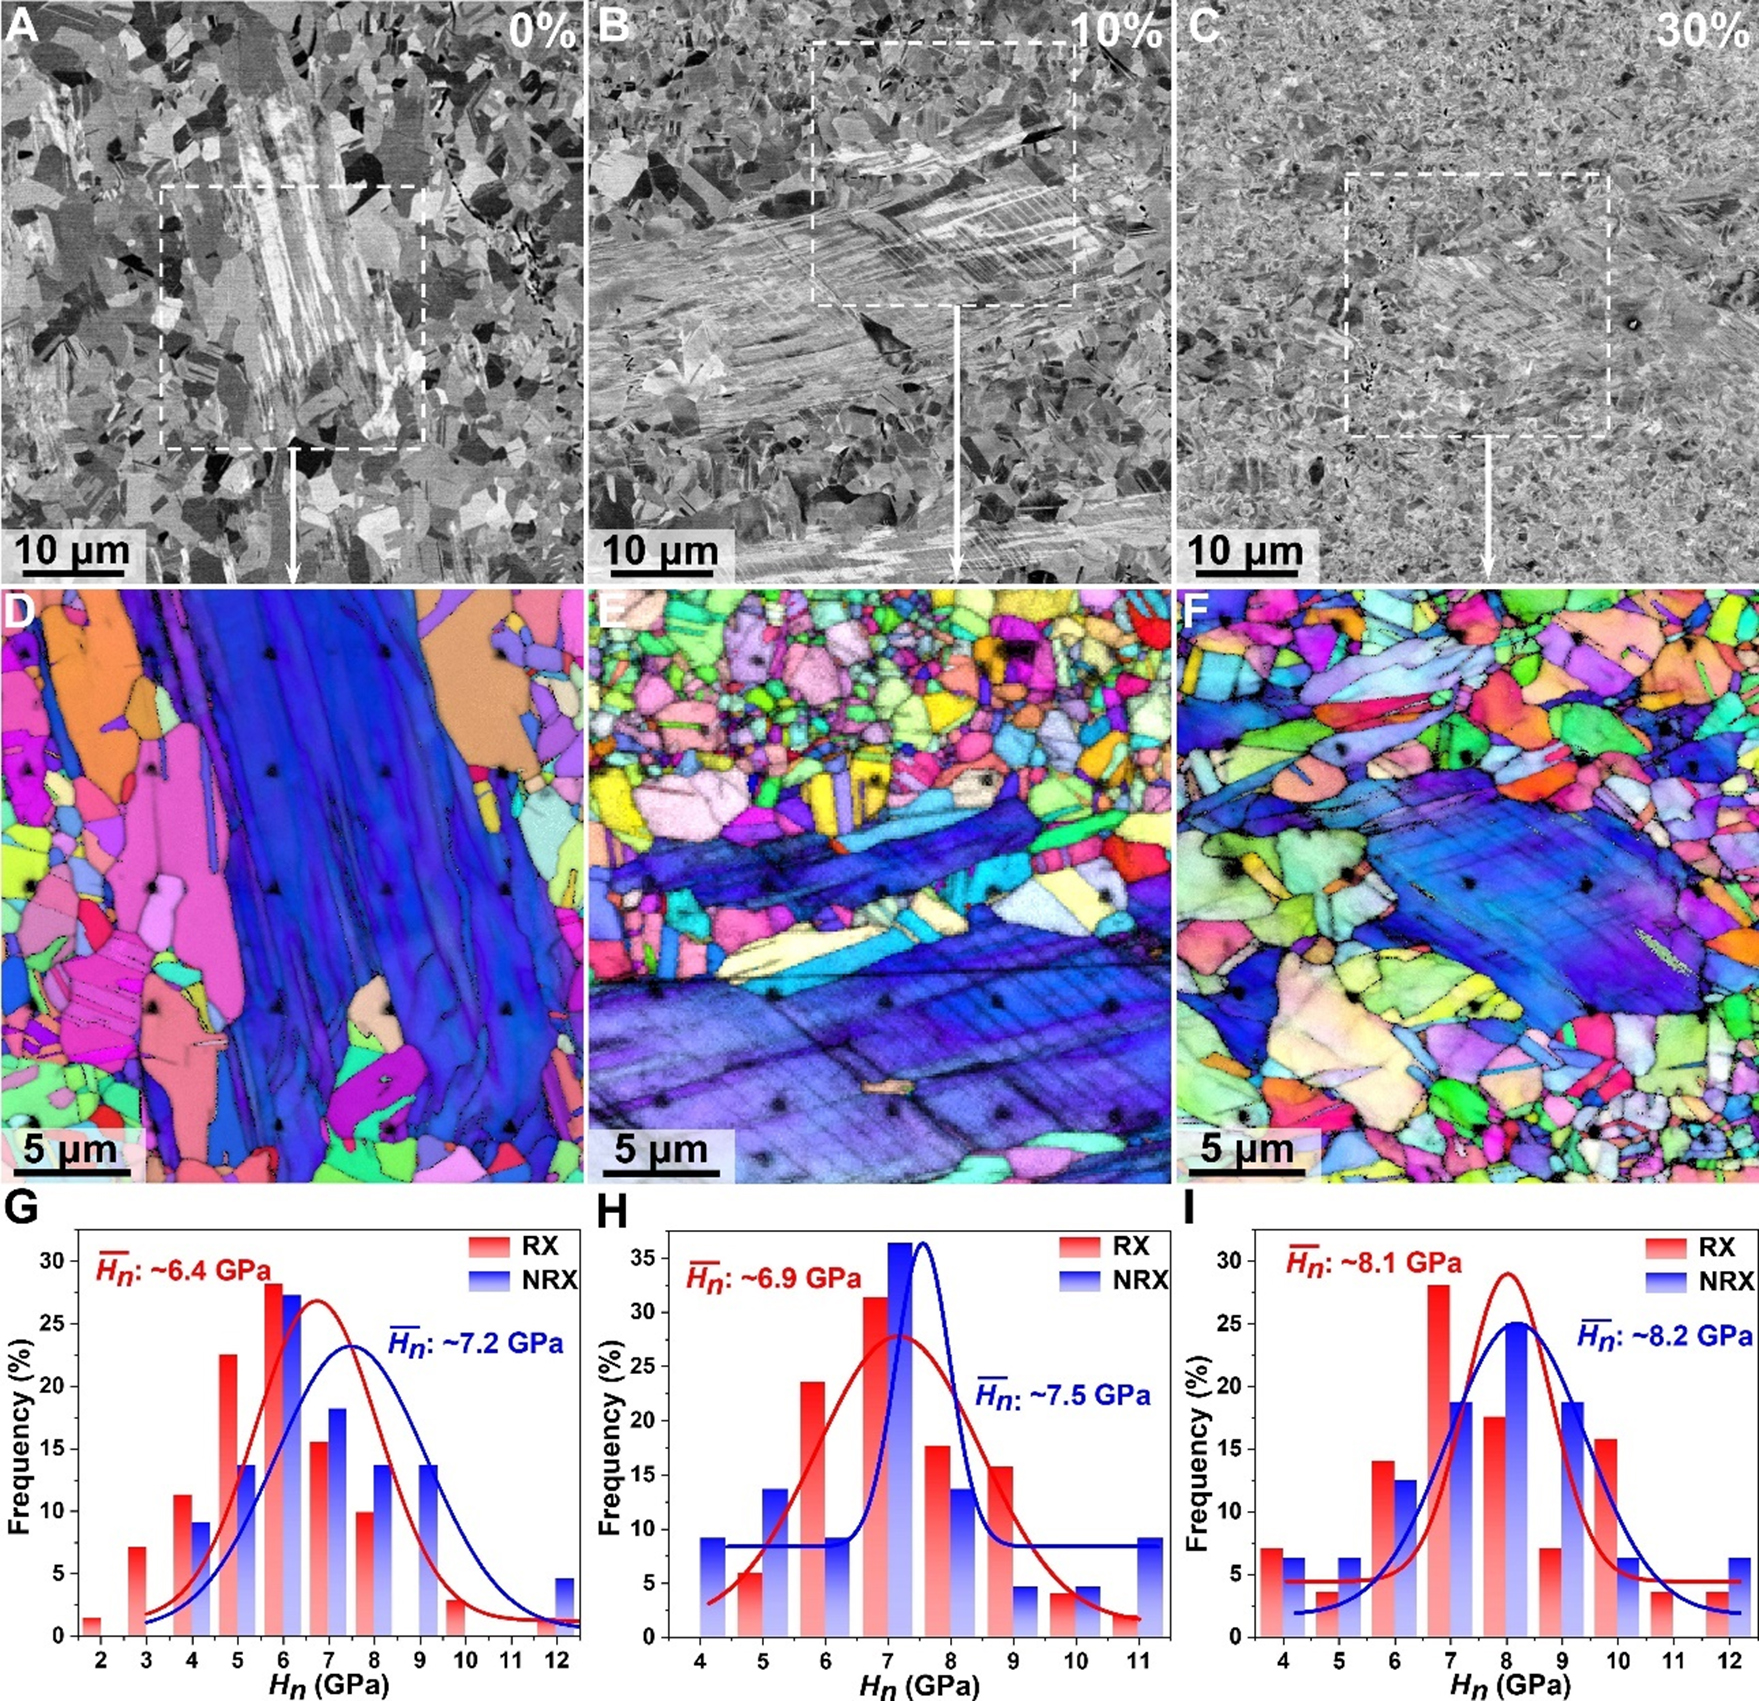
Figure 9. Nanoindentation analysis of the HS-HEA at 0%, 10%, and 30% plastic strain. (A-C) The ECC micrograph revealing the microstructure evolution; (D-F) Representative EBSD IPF images overlayed IQ maps showing nano-indents in both recrystallized (RX) and non-recrystallized (NRX) zones, respectively; (G-I) The distribution of nanoindentation hardness (Hn) in RX and NRX zones.


