


fig8
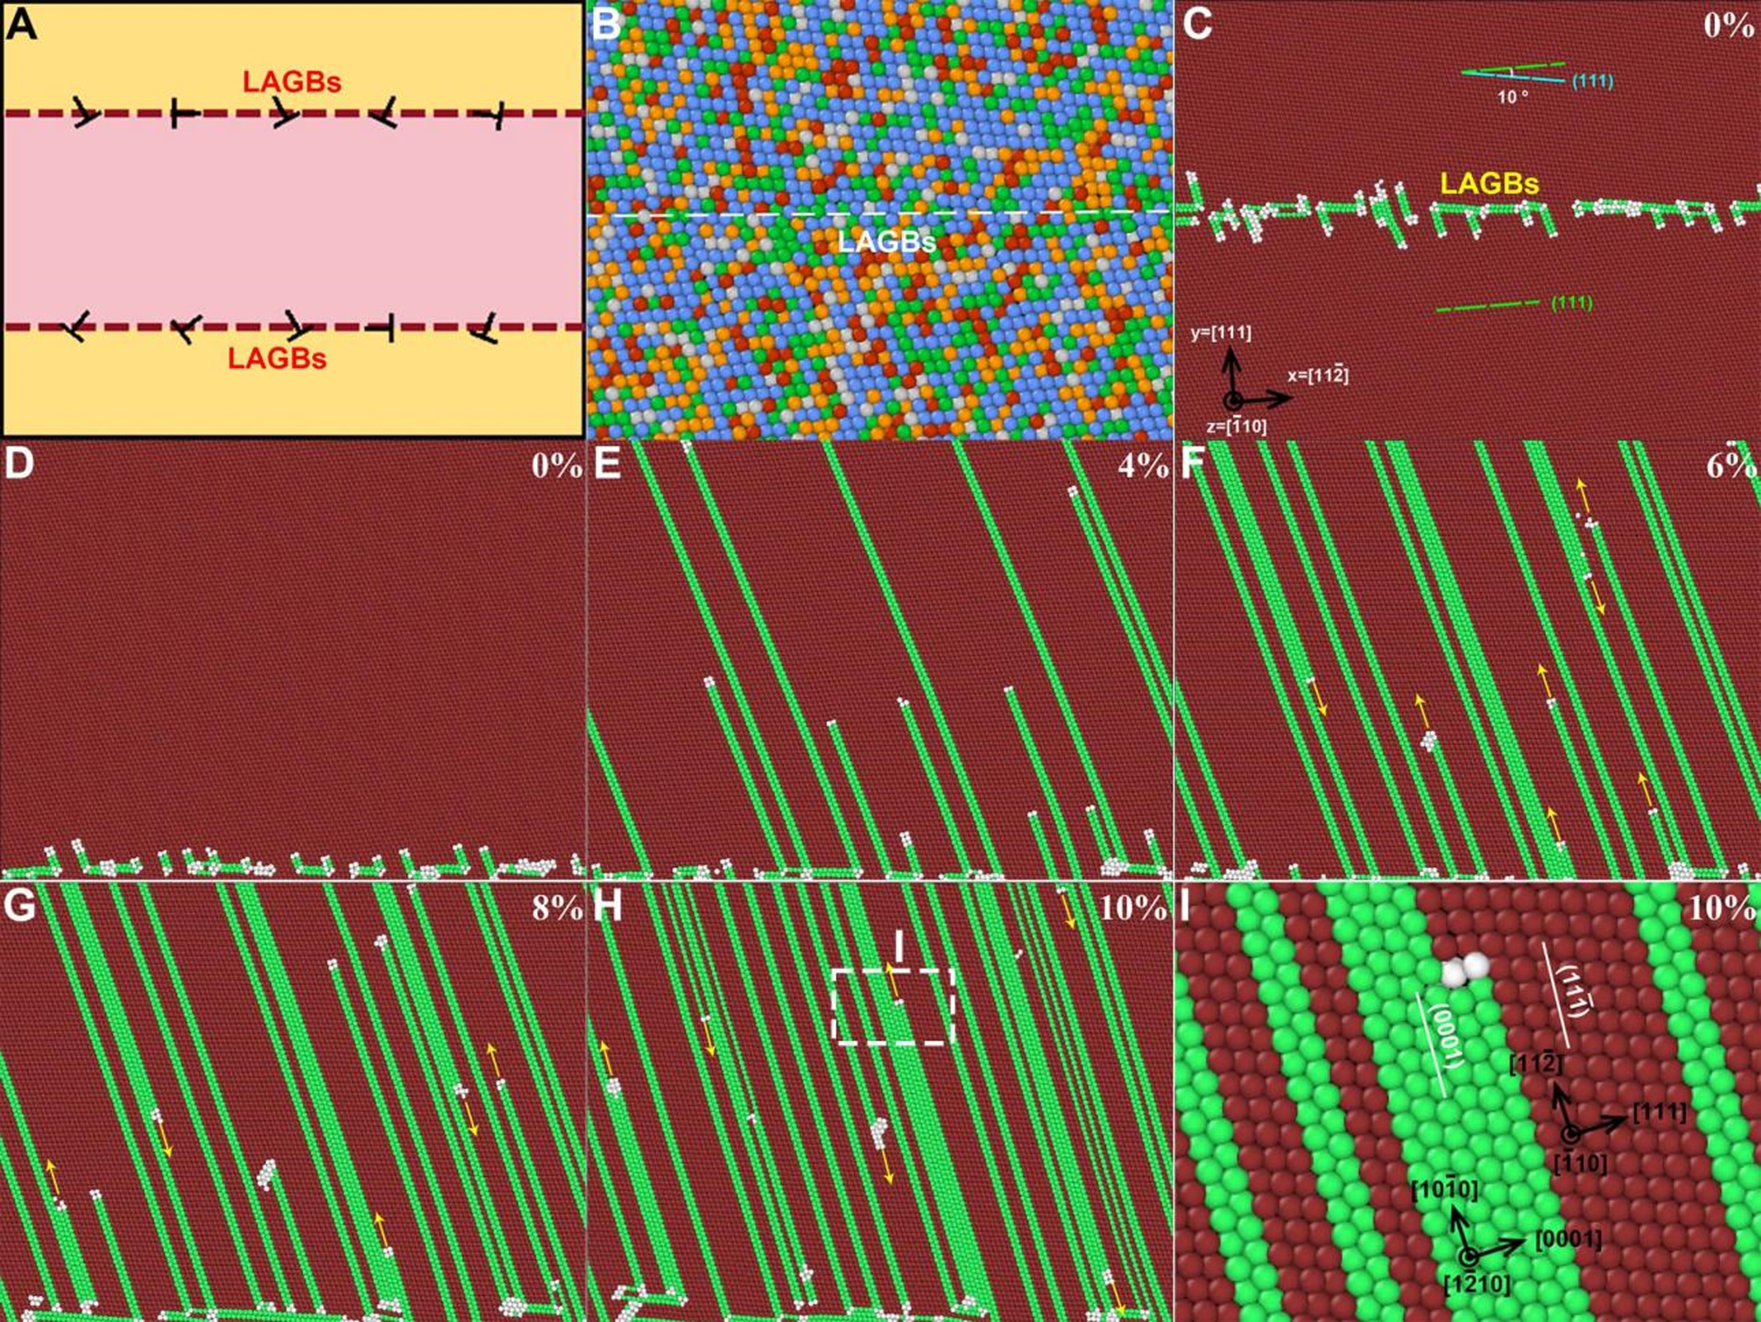
Figure 8. MD simulations revealing dislocation-mediated martensite phase transformation. (A) Schematic of the simulation model with two LAGBs (dashed lines). “T” symbols indicate dislocations at LAGBs; (B) Random distribution of various elements in the model and (C) atomic structure of relaxed LAGB. The misorientation between LAGB is about 10°; (D-H) The FCC-HCP phase transformation with increasing strain: (D) 0%, (E) 4%, (F) 6%, (G) 8%, and (H) 10%; (I) The magnified image of (H) showing the orientation relationship between the HCP and FCC phases. The atoms are colored according to common neighbor analysis. The arrows indicate the glide direction of the partial dislocations. MD: Molecular dynamic; LAGBs: low-angle grain boundaries; LAGB: low-angle grain boundary; FCC: face-centered cubic; HCP: hexagonal close-packed.


