


fig5
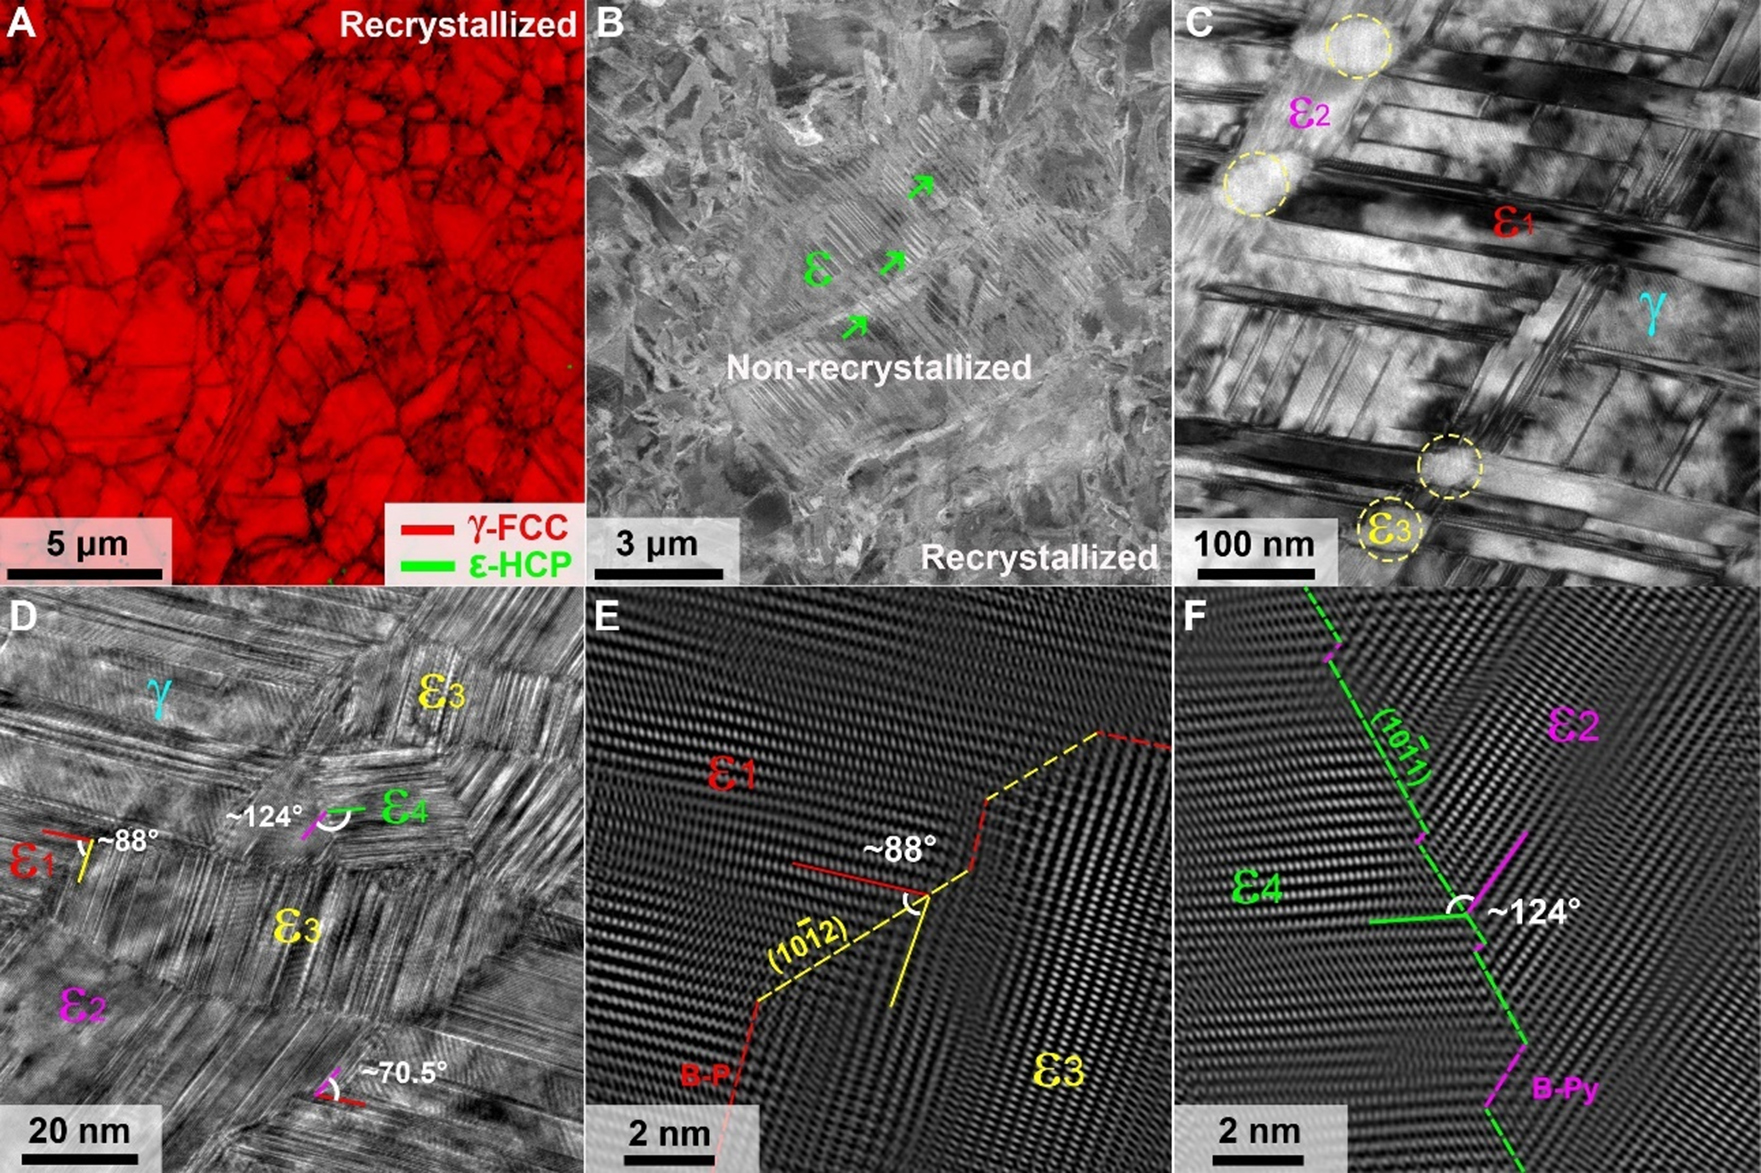
Figure 5. Sustained heterogeneous deformation substructures in the HS-HEA at 30% strain. (A) EBSD phase map overlayed IQ maps in the recrystallized zones; (B) ECC image showing the heterogeneous deformation behavior between the recrystallized and non-recrystallized zones; (C) The BF-TEM image indicating HCP interactions in the non-recrystallized zone. ε(1-4) represent HCP variants with different orientations, while γ represents the FCC matrix; (D) The HR-TEM image of the HCP intersections area; (E and F) The fast Fourier transform filtered HR-TEM image of the boundary structure marked in (D). The orientation of ε phases at junction areas is marked, which indicates


