


fig6
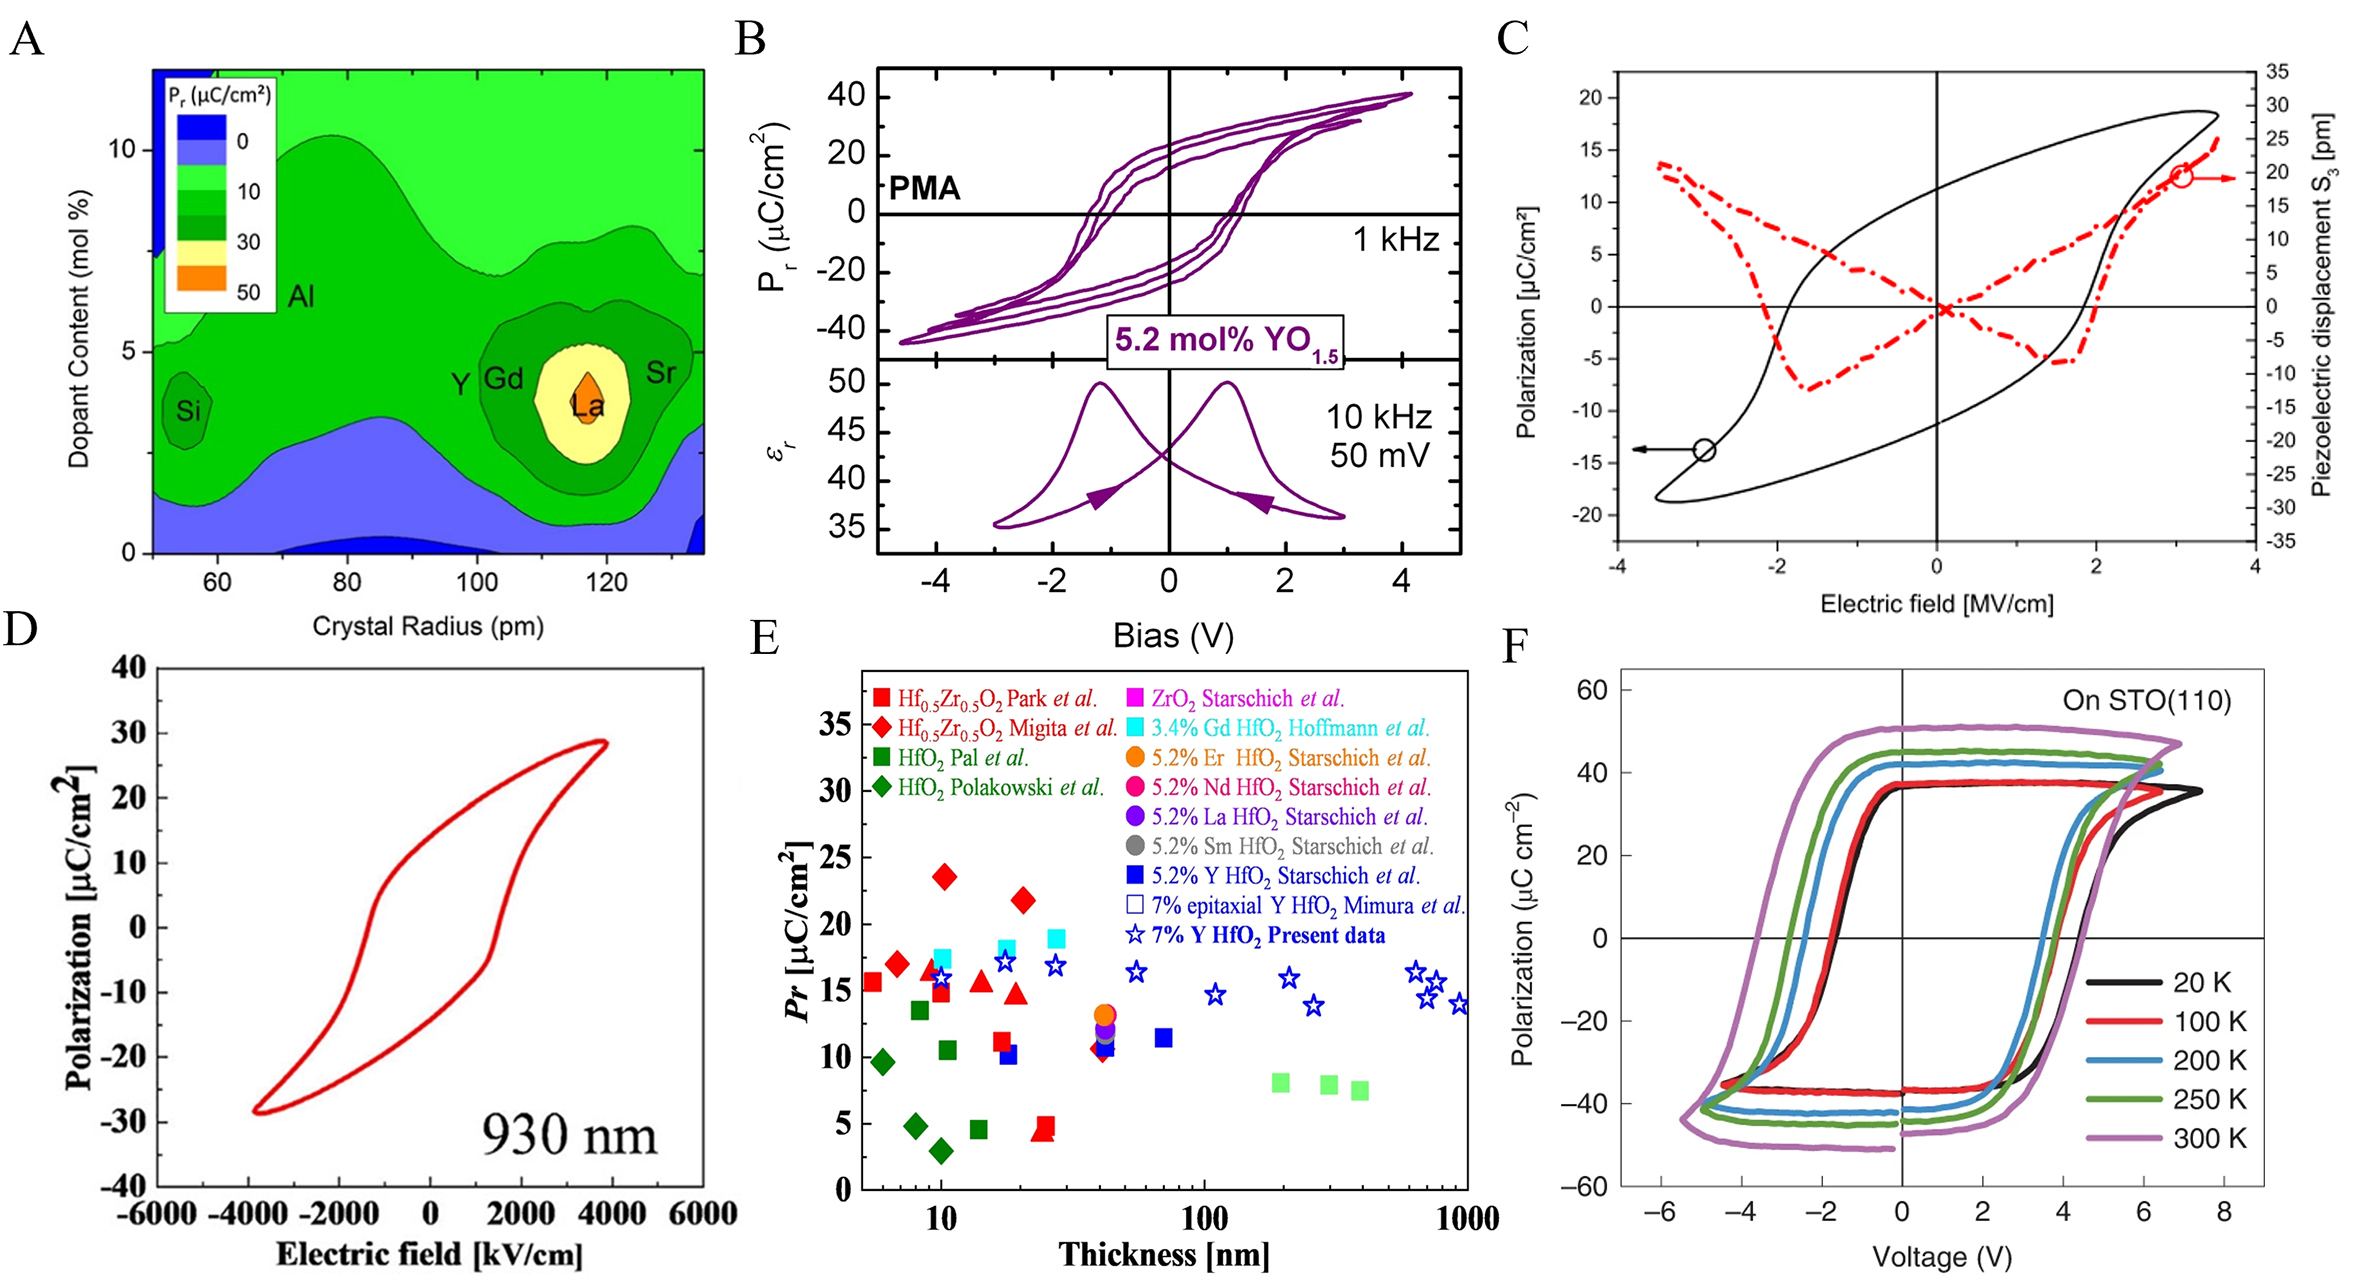
Figure 6. (A) Contour plots of the variation of Pr value with crystal radius and doping amount[44]. Reprinted figures with permission from Ref.[44] Copyright by IOP Publishing, Ltd. (B) P-V curve and C-V curve[46]. Reprinted from[46], with permission from AIP Publishing. (C) Piezoelectric measurement and P-V curve of 70 nm Y:HfO2 capacitor[47]. Reprinted from[47], with permission from AIP Publishing. (D) P-E loops for Y:HfO2 films with a thickness of 930 nm[48]. (E) Thickness dependence of Pr for doping HfO2-based films[48]. Reprinted from[48], with permission from AIP Publishing. (F) Typical P-V loops of Y:HfO2 films measured from 20 to 300 K[49]. Reprinted from Ref.[49], with permission from Springer Nature.


