


fig3
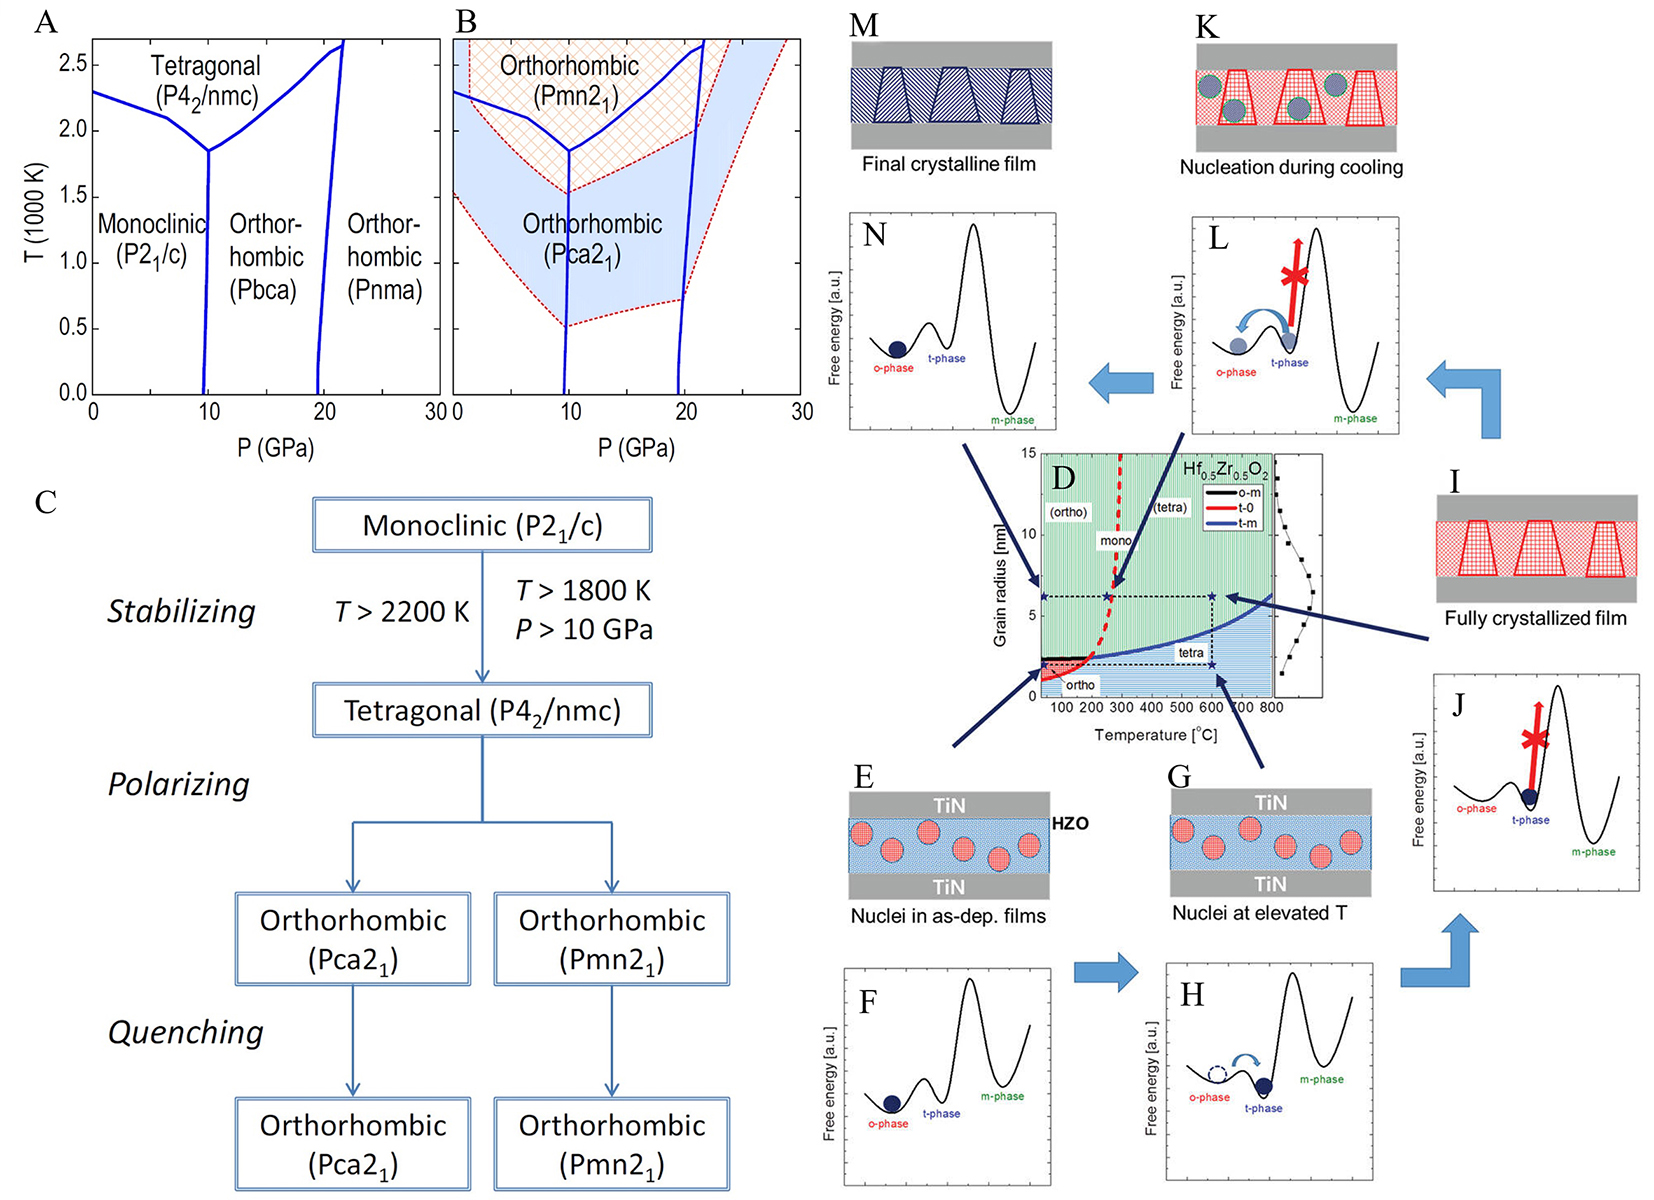
Figure 3. (A) Equilibrium phase diagram of HfO2. (B) Regimes showing the free energy difference between the Pca21 and Pmn21 phases. (C) Possible pathways for the formation of the polar phase[19]. Reprinted figures with permission from Ref.[19] Copyright by the American Physical Society. (D) Phase diagram illustrating the relationship between grain radius and temperature for HZO thin films. (E, G, I, K, M) Illustrative schematic figures; (F, H, J, L, N) Corresponding free energy curves[23]. Figures reprinted with permission from Ref.[23] Copyright by the Wiley Company.


