


fig19
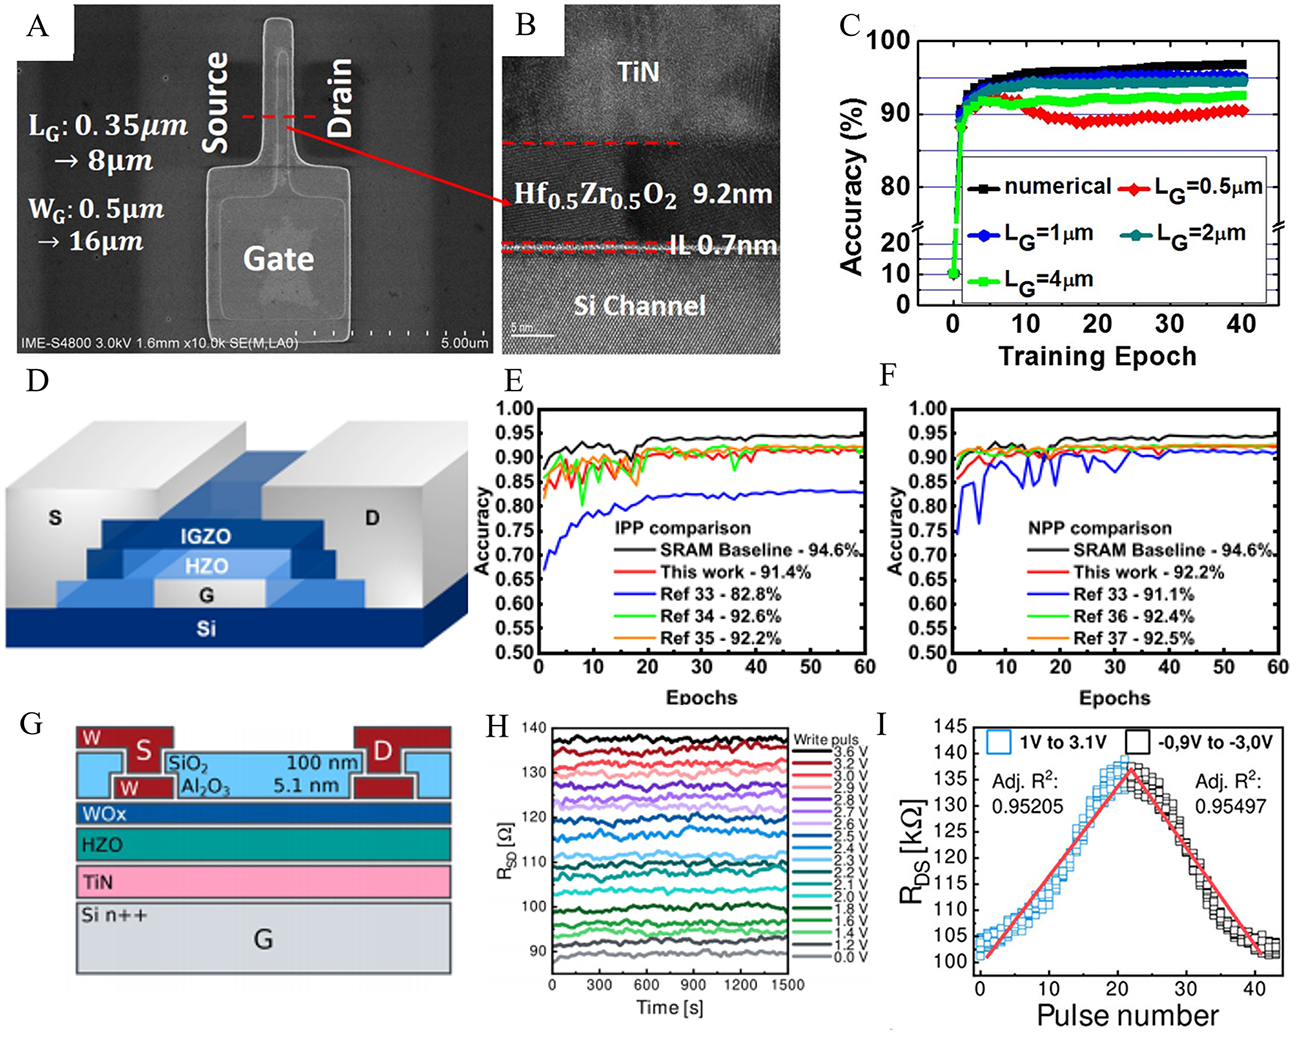
Figure 19. (A) Top-view scanning electron microscopy image, (B) HRTEM image, (C) recognition accuracy of different experimental devices and the ideal numeric values of FeFET[151]. Reprinted figures with permission from Ref.[151] Copyright by IOP Publishing, Ltd. (D) Schematic diagram of the device structure. The potentiation and depression behavior in FeFETs with (E) IPP and (F) NPP operating modes[152]. Reprinted (adapted) with permission from Ref.[152]. Copyright (2022) American Chemical Society. (G) Schematic illustration of the FeFET. (H) Retention tests for different resistance states. (I) The potentiation and depression behavior[153]. Reprinted (adapted) with permission from Ref.[153]. Copyright (2020) American Chemical Society.


