


fig18
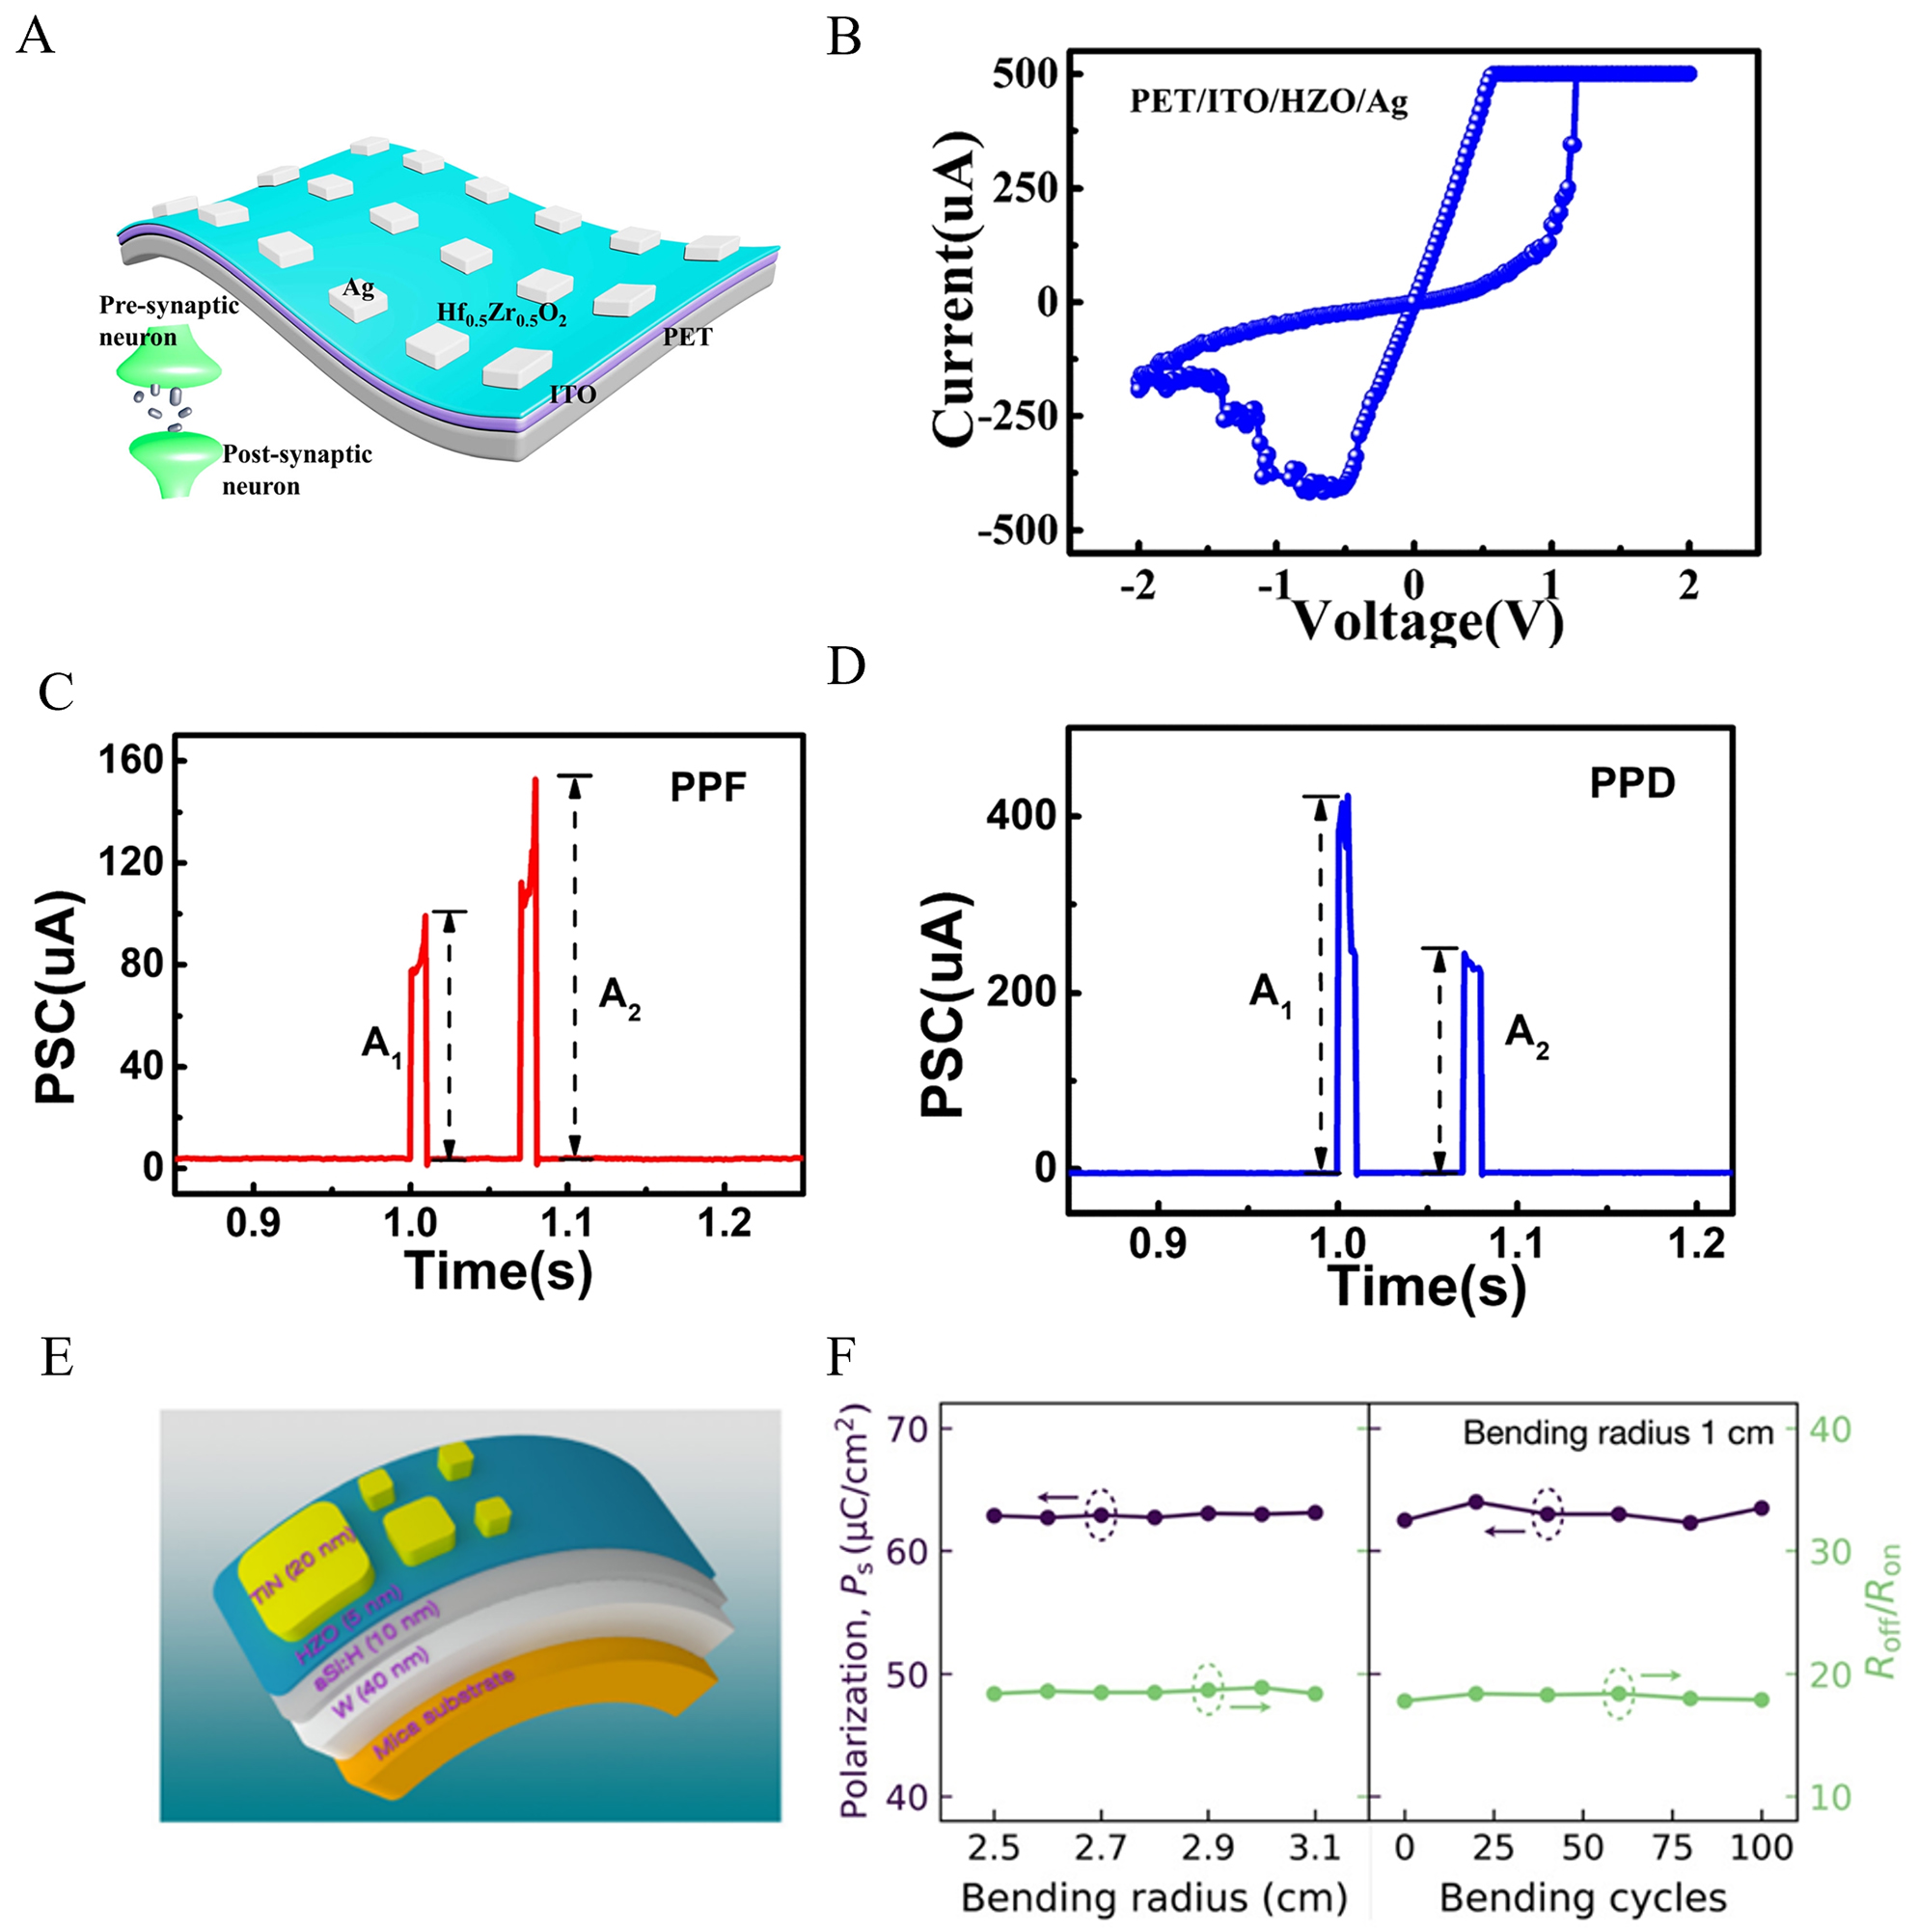
Figure 18. (A) Schematic diagram of ITO/HZO/Ag device structure. Typical (B) I-V characteristic curve, (C) PPF curve, and (D) PPD curve of PET/ITO/HZO/Ag device[144]. Reprinted from Ref.[144], with permission from Springer Nature. (E)Schematic diagram (F) properties during bending tests of HZO-based flexible devices[145]. Reprinted from[145], with permission from AIP Publishing.


