


fig16
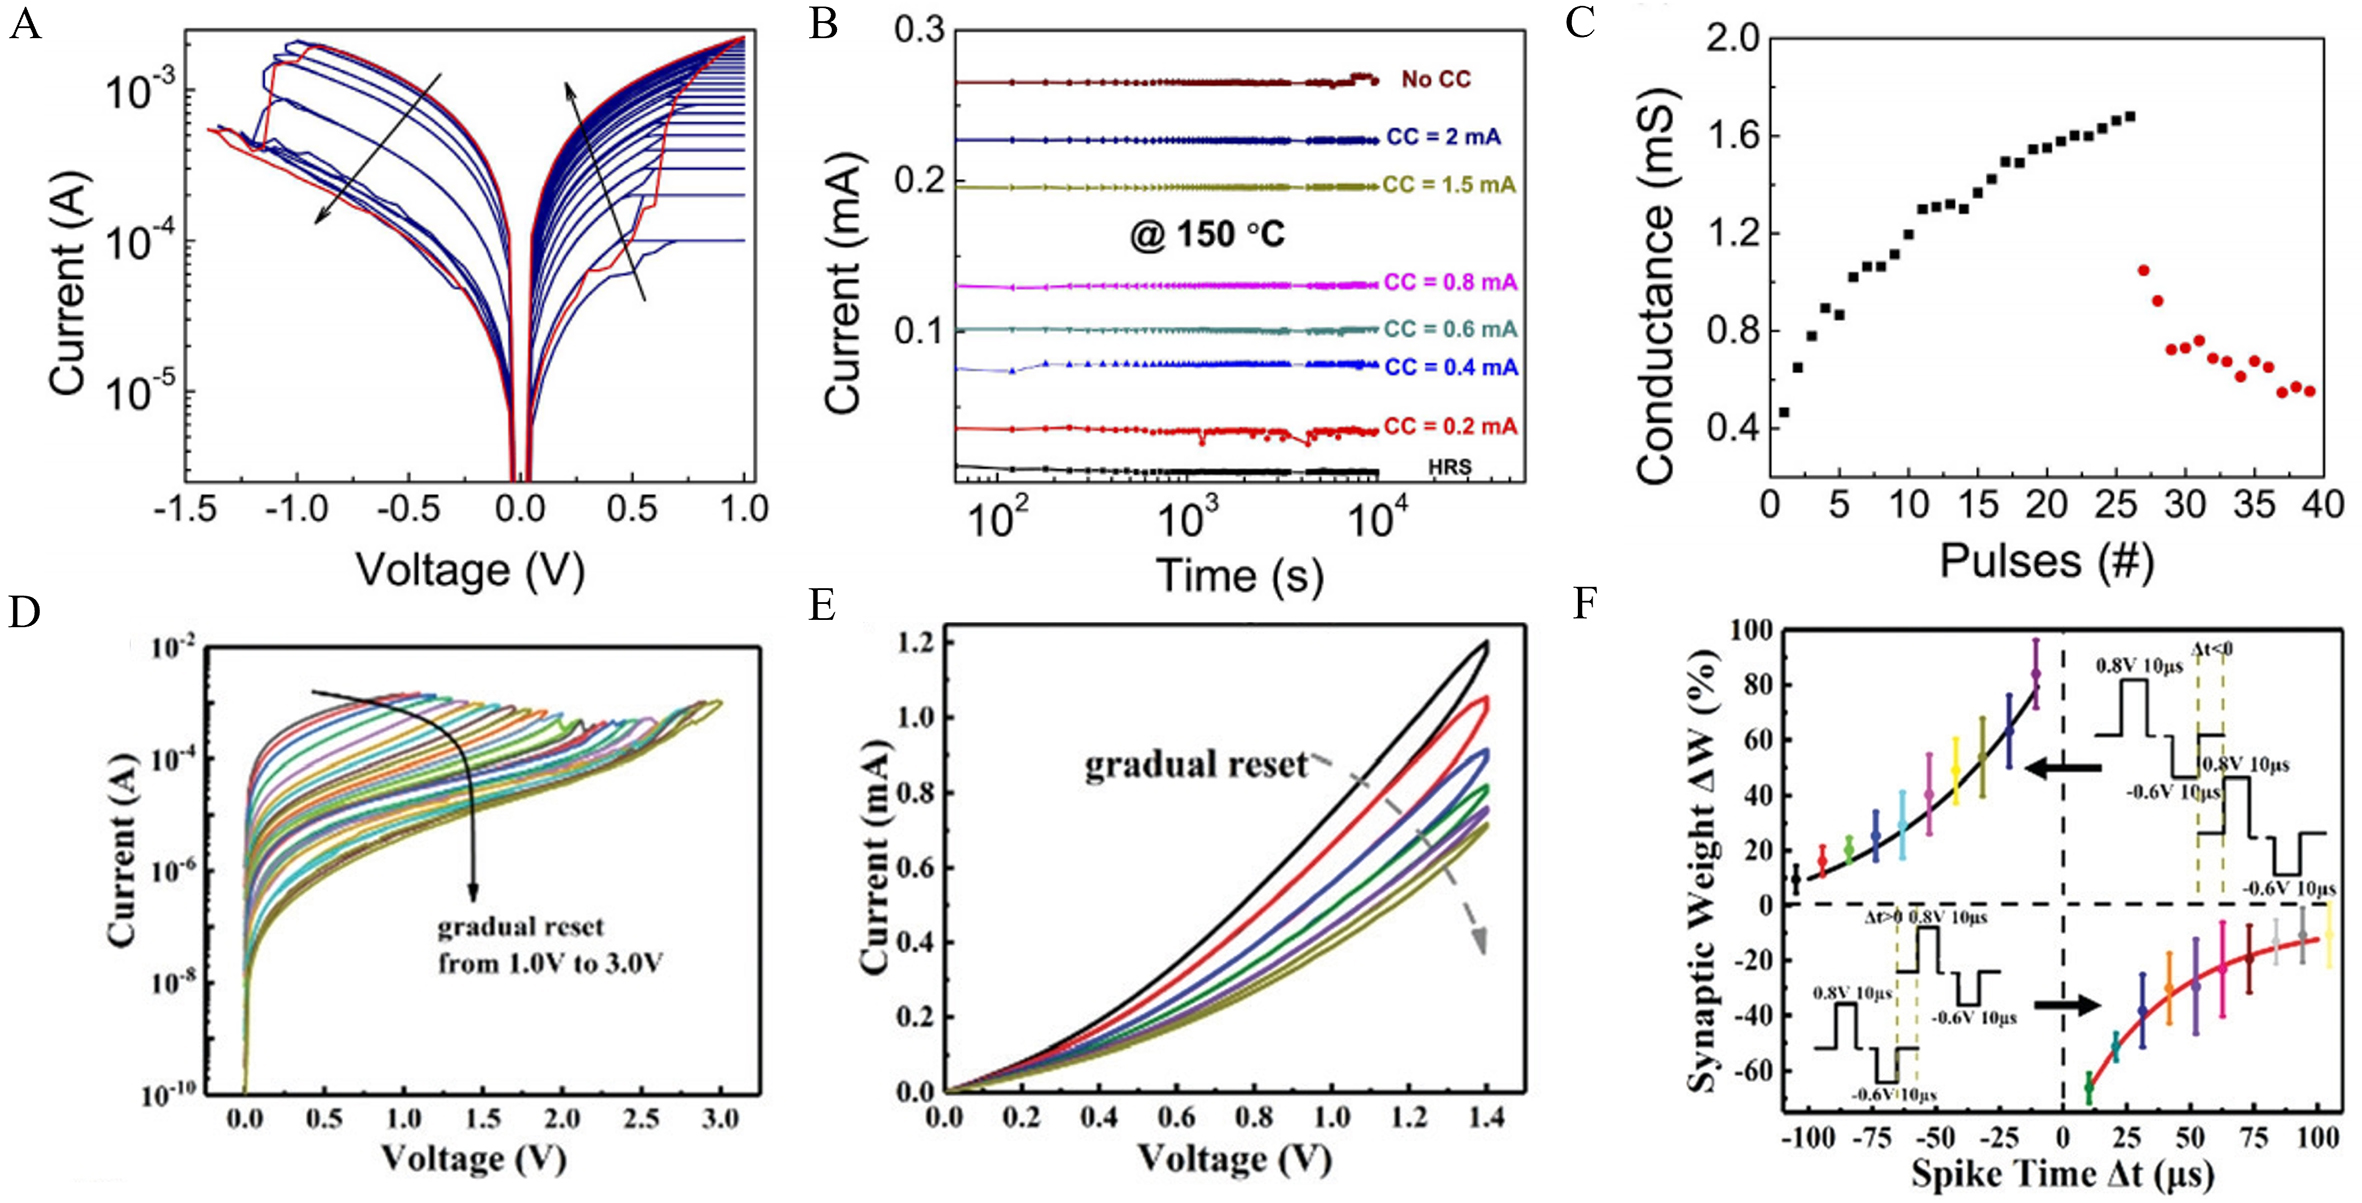
Figure 16. (A) The resistance states of the device adjusted by changing the compliance current setting. (B) Retention testing of the device. (C) The simulated switching behavior of the device[140]. Reprinted from Ref.[140], with permission from Springer Nature. (D) The measured I-V curve of the resistive device with gradually increasing reset voltages from 1.0 to 3.0 V. (E) The I-V curves of the resistive device measured by applying positive 1.4 V bias voltages six times. (F) The STDP curve of the device[141]. Reprinted from Ref.[141], with permission from the Royal Society of Chemistry.


