


fig10
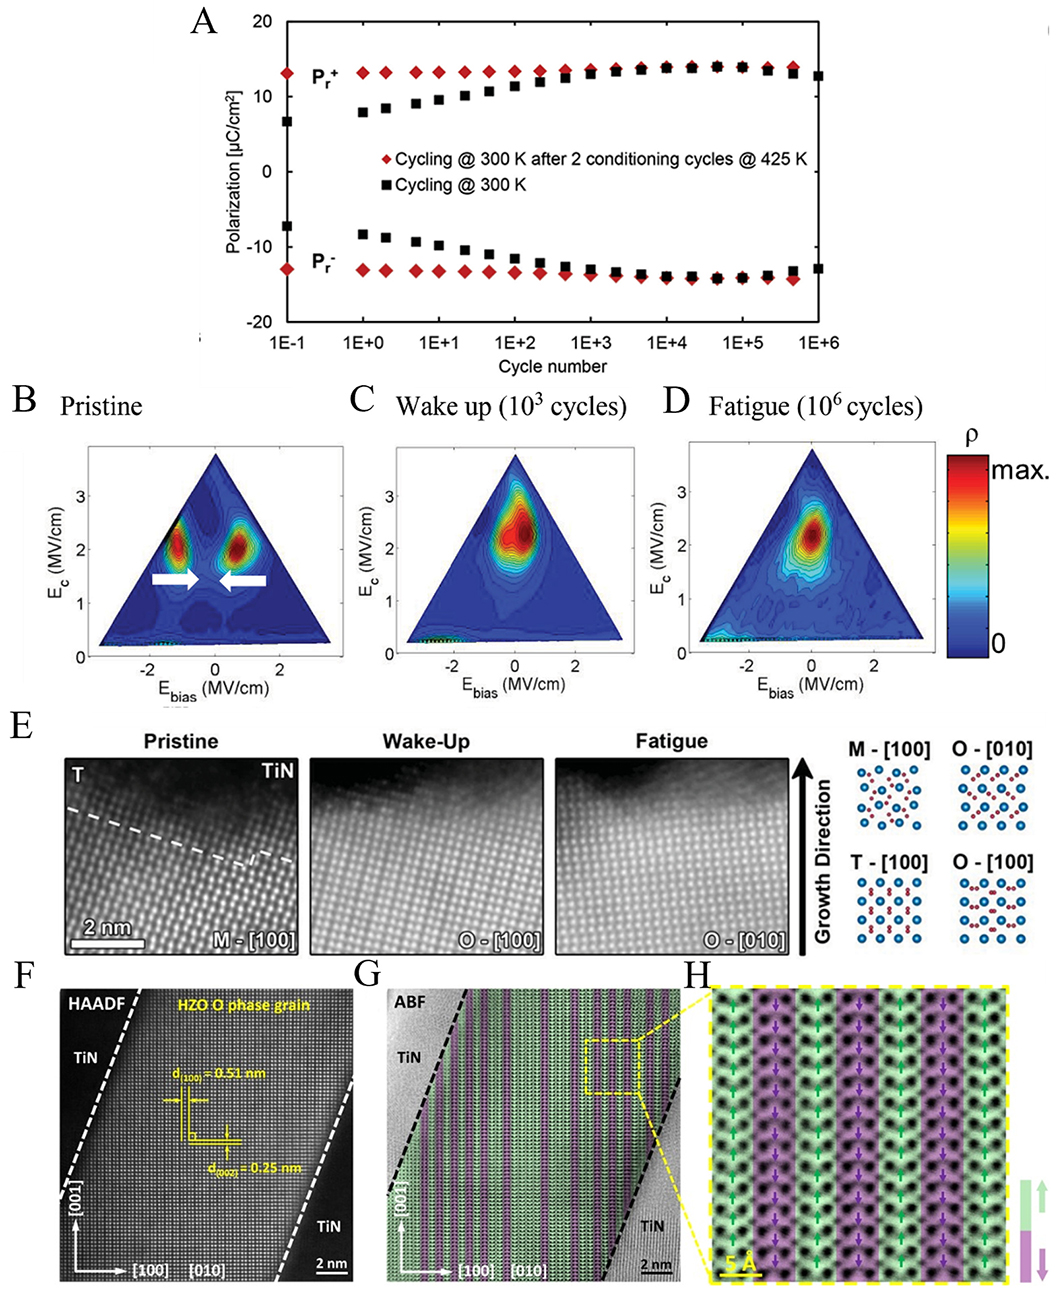
Figure 10. (A) Wake-up and fatigue behaviors of HZO devices. In (B) 1, (C) 1,000, and (D) 106 cycles. (E) HAADF-STEM images with HfO2 doping in the pristine, wake-up, and fatigue states, along with theoretical schematic diagrams of different phases[91]. Reprinted from Ref.[91], with permission from Wiley. (F) HAADF cross-sectional image of TiN/HZO/TiN device after 107 cycles of fatigue. (G) Corresponding ABF image of (F). (H) Magnified ABF image obtained from the green square region in (G)[92]. Reprinted from Ref.[92], with permission from Springer Nature.


