


fig5
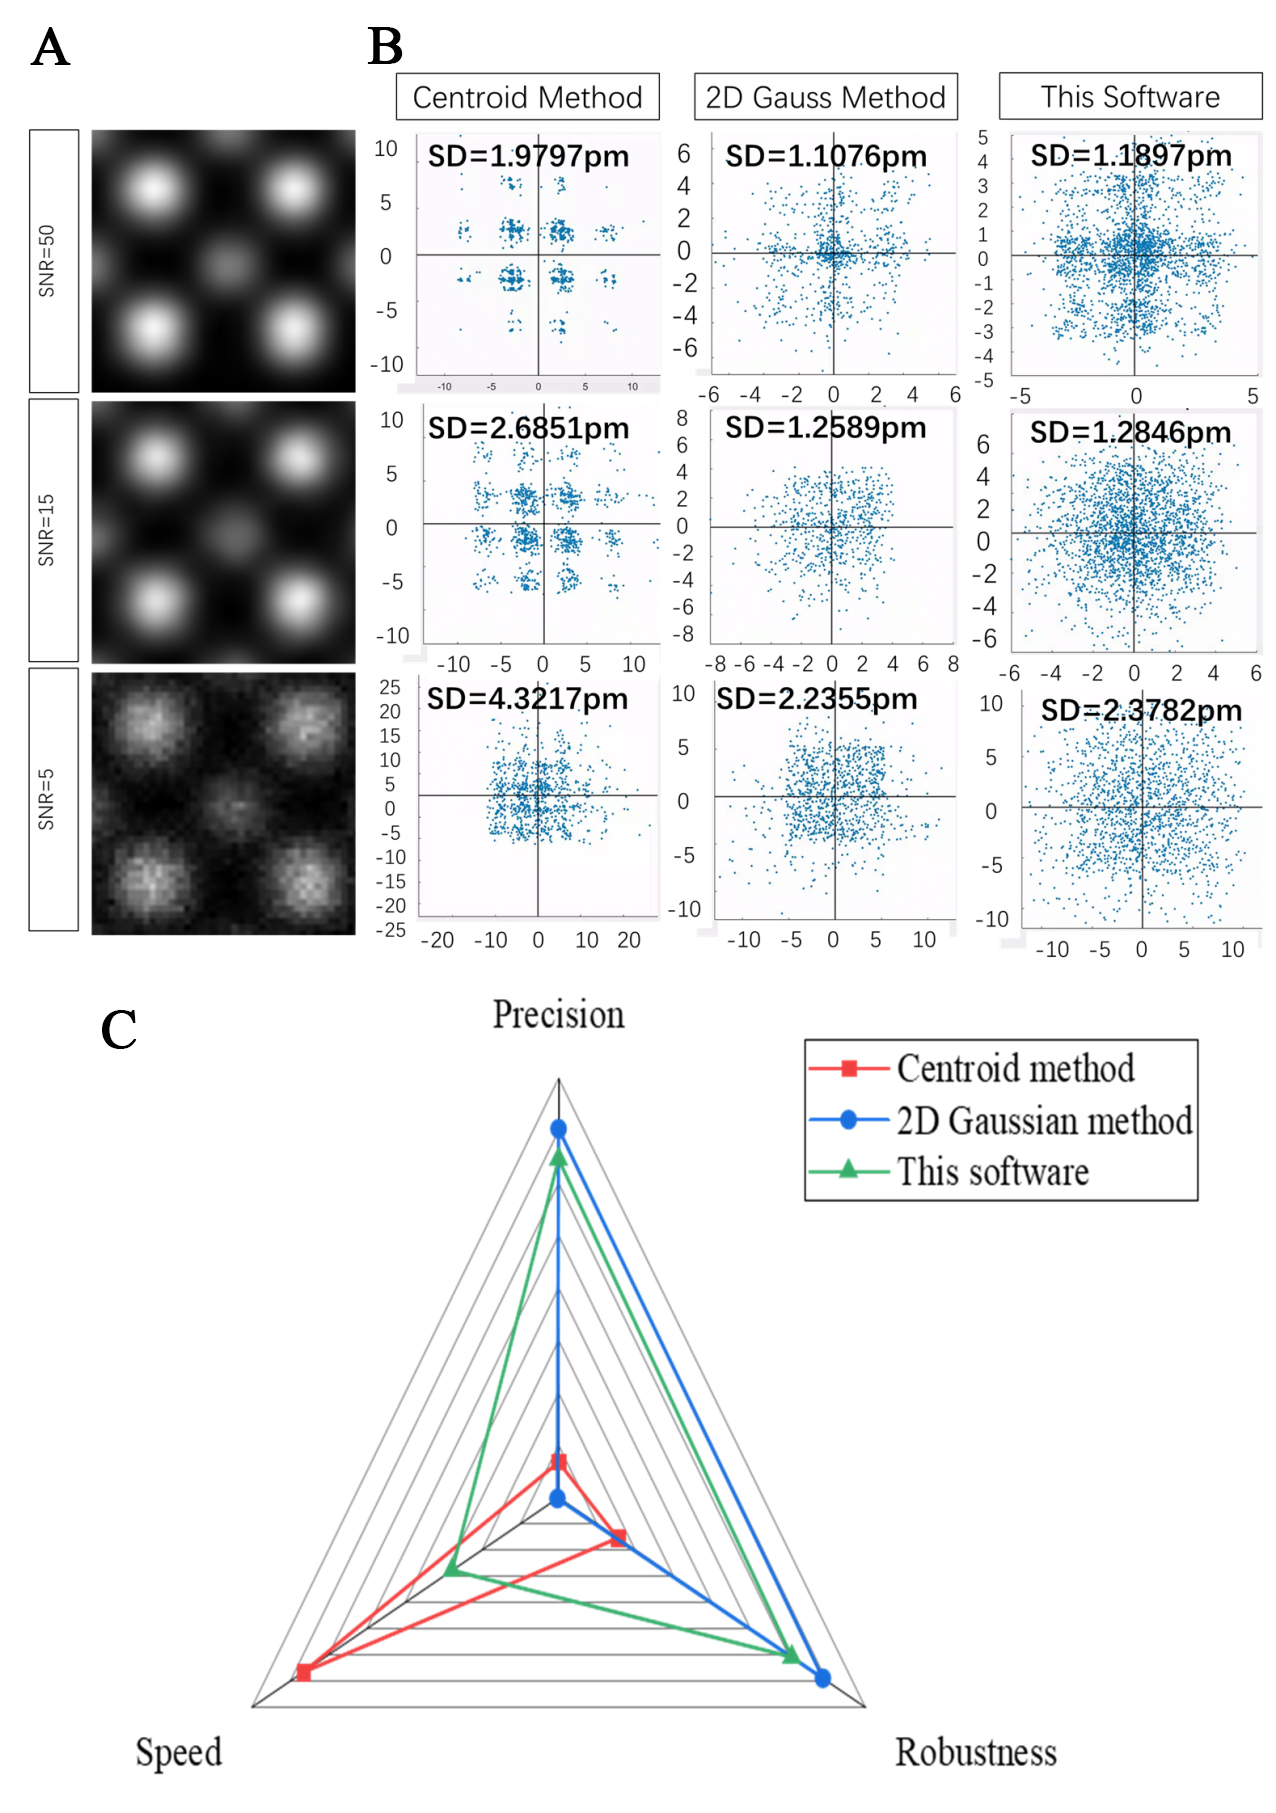
Figure 5. Simulation of HAADF images with B-site intensity at 50% of A-site intensity. (A) Enlarged views of a single lattice for SNR values of 50, 15, and 5; (B) Comparison of measurement precision among the proposed software, the centroid method, and the 2D Gaussian fitting method under SNR values of 50, 15, and 5, illustrated by scatter plots of the differences between the observed and theoretical displacements; (C) Radar map comparing the three methods in terms of speed, precision, and robustness. HAADF: High-angle annular dark-field; SNR: signal-to-noise ratio; 2D two-dimensional.


