


fig3
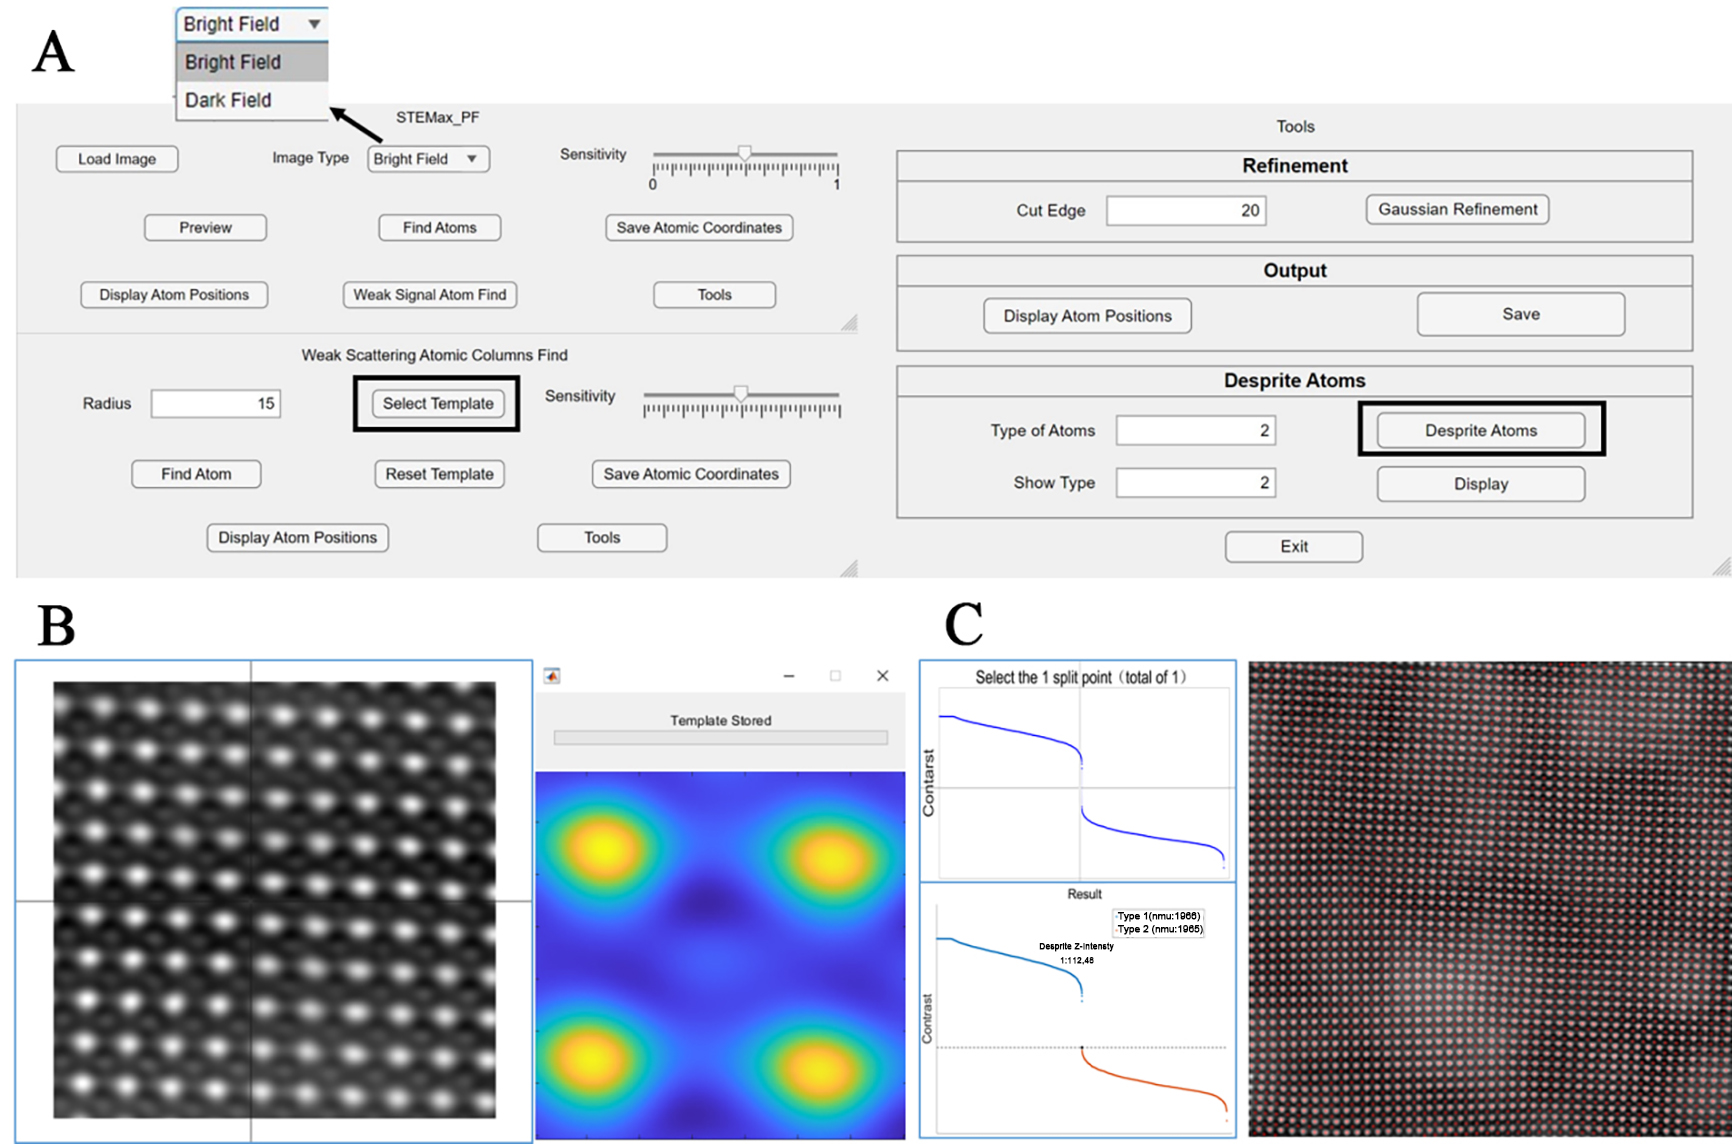
Figure 3. Schematic diagram of the software interface. (A) Interface pages for the three main programs; (B) Operational interface after clicking the “Select Template” button, where users sequentially select three templates using the crosshair; (C) Operational interface after clicking the “separate atoms” button, allowing users to categorize atoms by contrast into desired types and view the positions of atoms in each category.


