


fig9
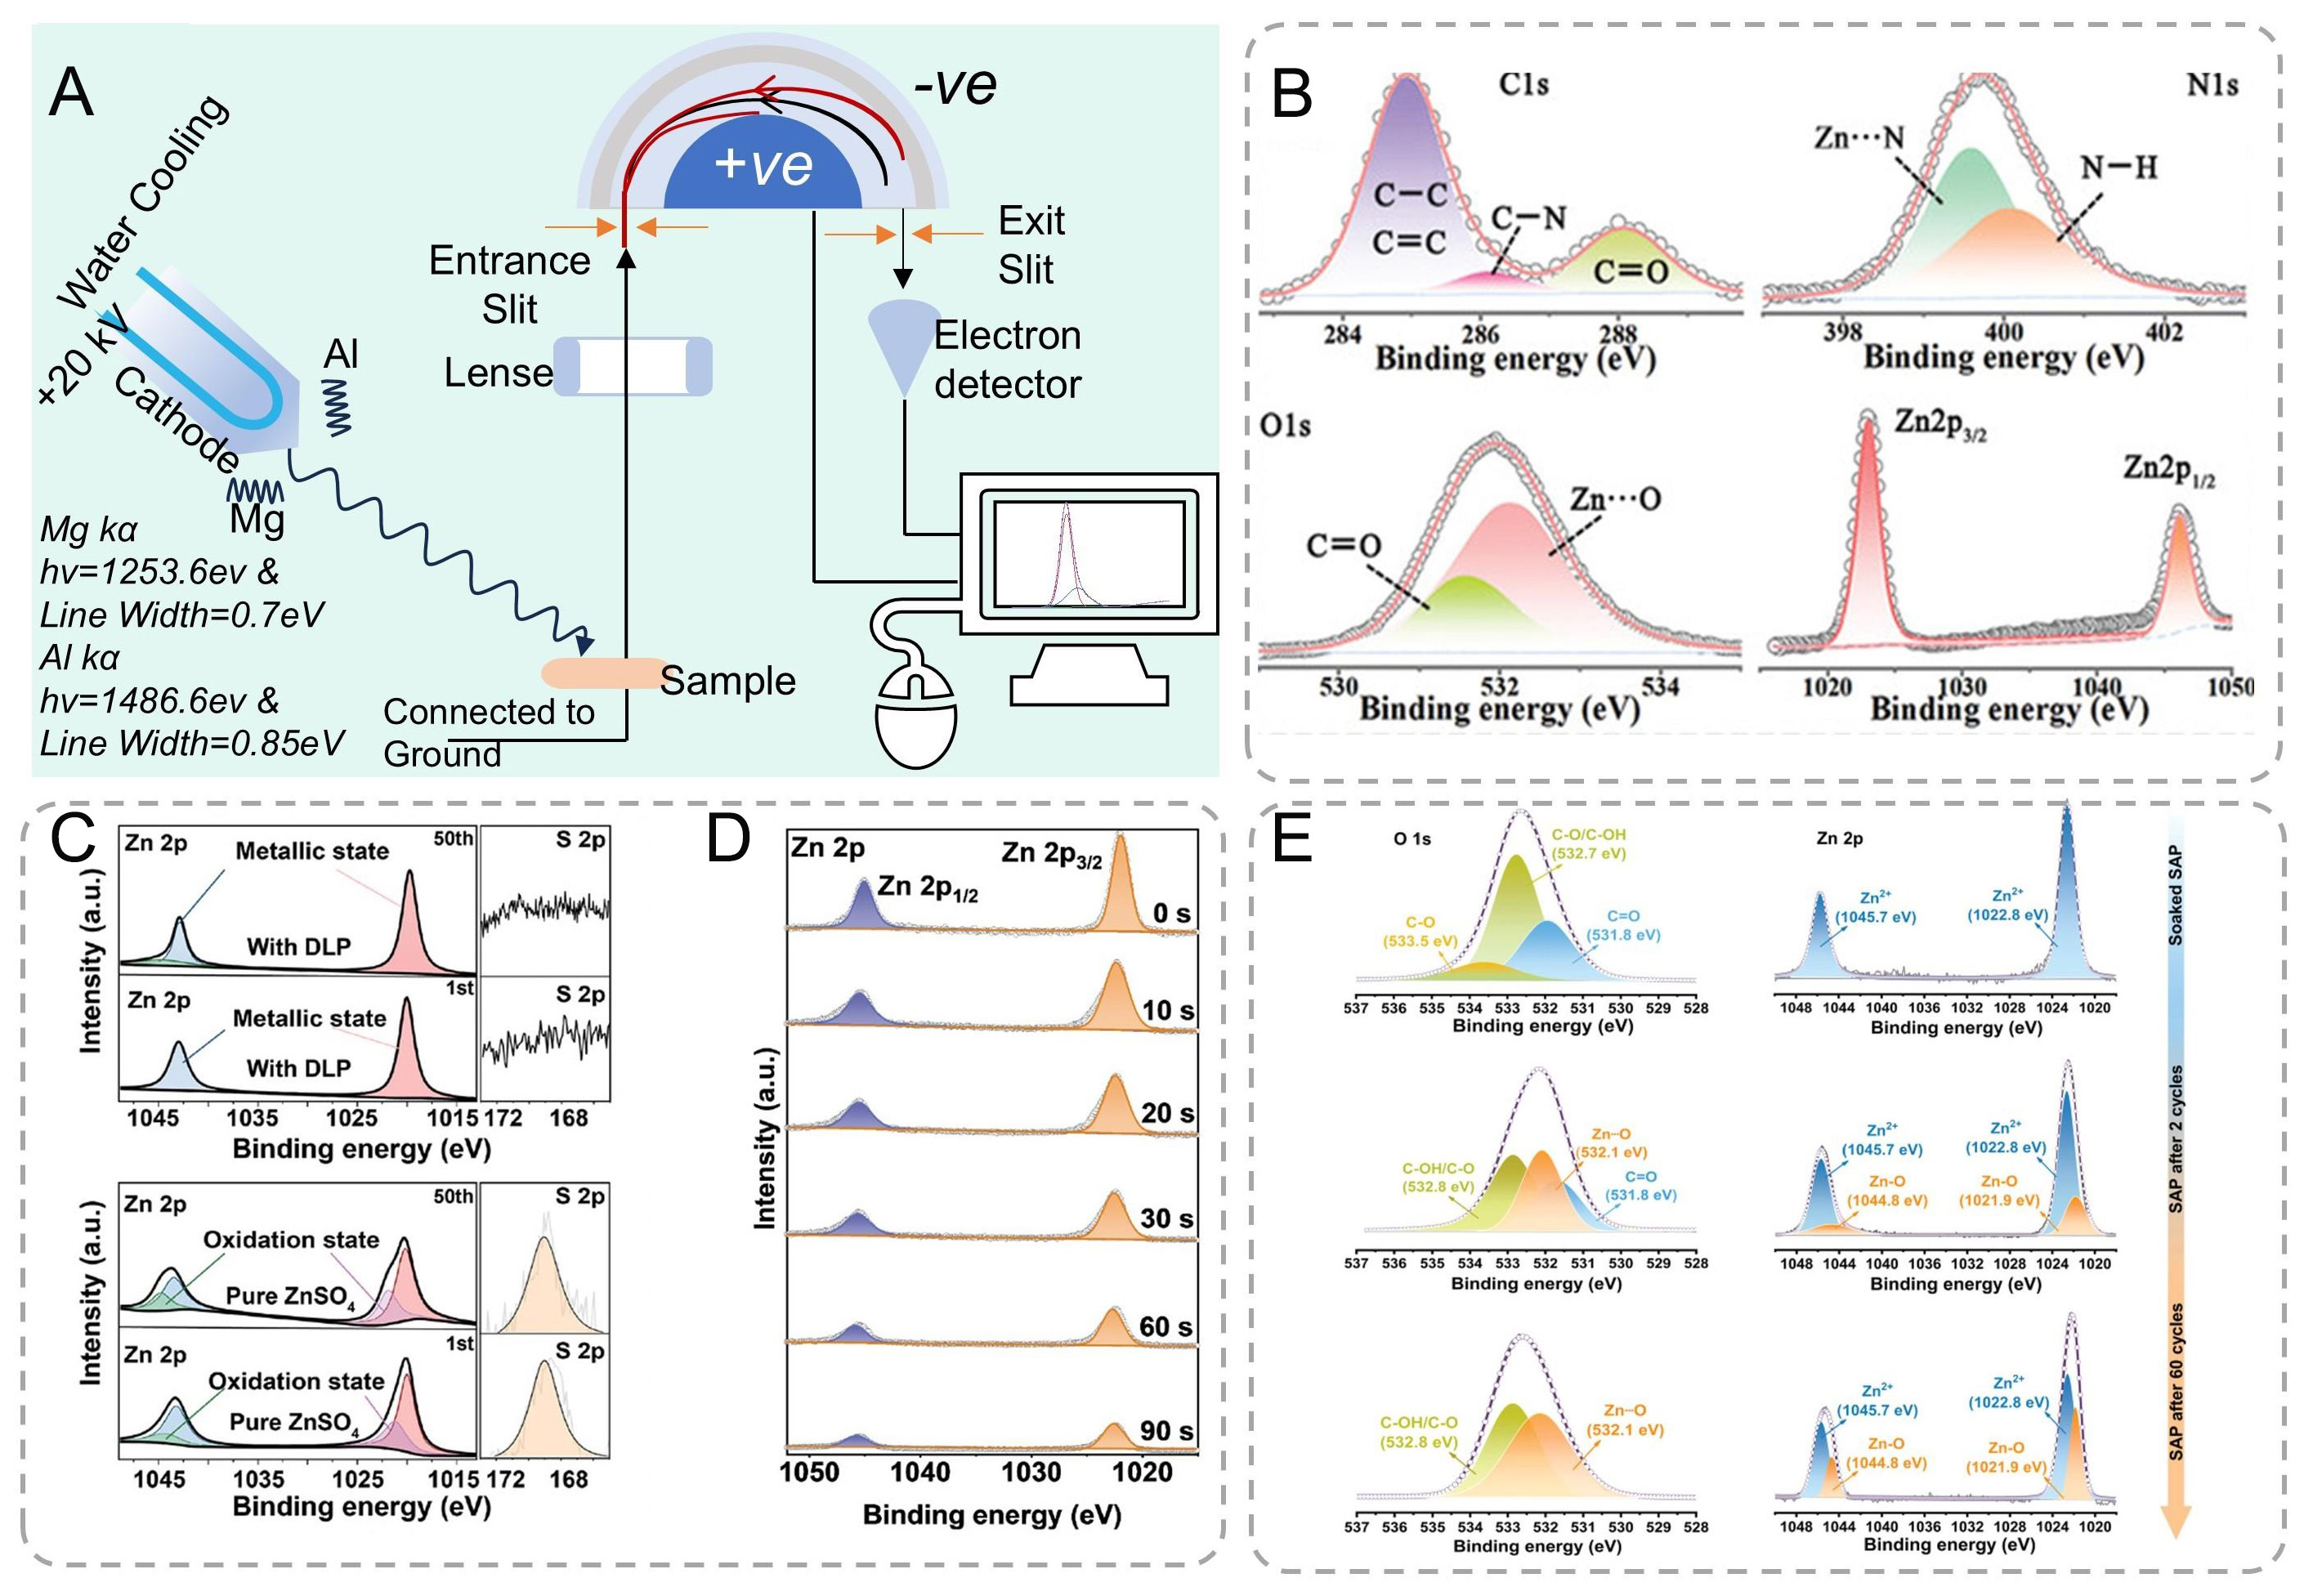
Figure 9. (A) Schematic illustration of X-ray photoelectron spectroscopy. (B) XPS of Zn foil separated from in situ GPE, showing peaks of C1s, N1s, O1s, and Zn2p[131]. Copyright 2022, Wiley. (C) XPS spectra for the Zn anode after the 1st and 50th cycles in each of the DLP/ZnSO4 and pure ZnSO4 electrolytes[132]. Copyright 2024, Wiley. (D) XPS depth analysis of Zn 2p of the SEI layer on Zn metal surface at different sputtering times[133]. Copyright 2022, American Chemical Society. (E) O 1s and Zn 2p XPS spectra of SAP-GF soaked in ZnSO4 electrolyte and SAP interface after 2 and 60 cycles in Zn||Zn cells[34]. Copyright 2024, Wiley.


