


fig8
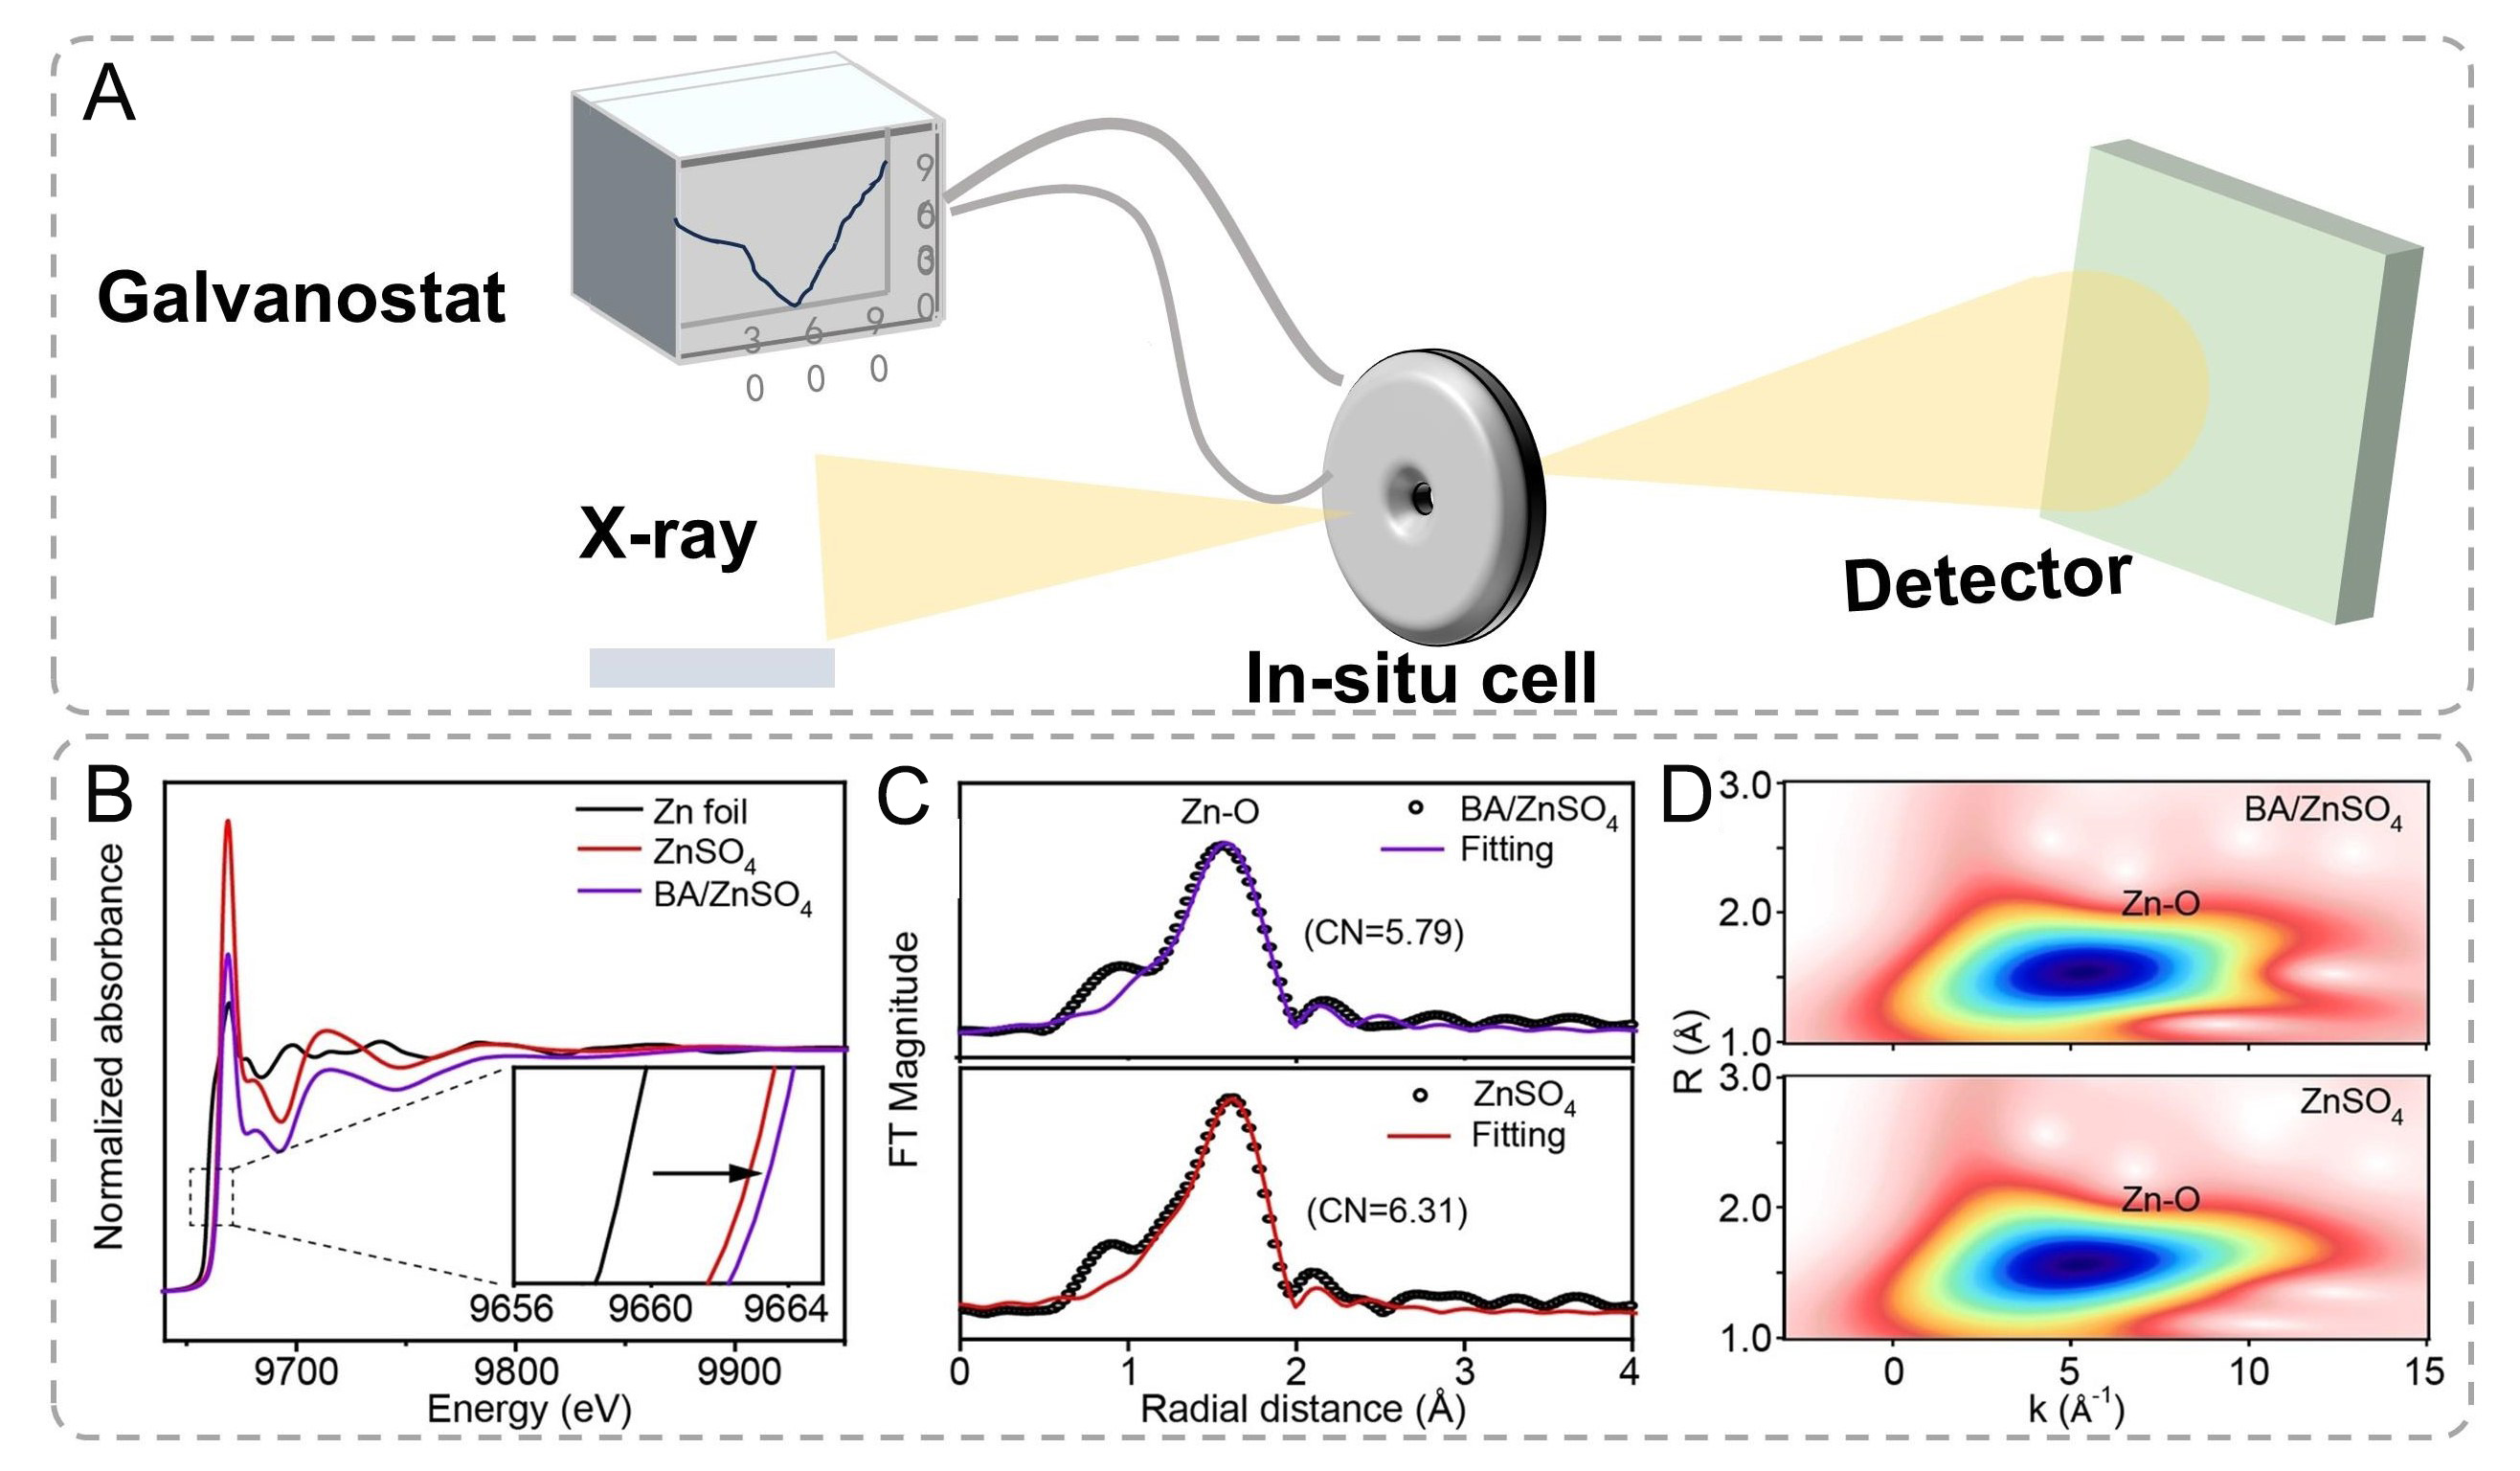
Figure 8. (A) Schematic illustration of X-ray adsorption spectroscopy. (B-D) The normalized Zn K-edge XANES spectra. Inset: the enlarged Zn K-edge XANES spectra. (C) The EXAFS spectra in R space. (D) Wavelet transform images of the EXAFS spectra. (B-D) are reproduced from Ref.[57]. with permission, Copyright 2022, Wiley.


