


fig6
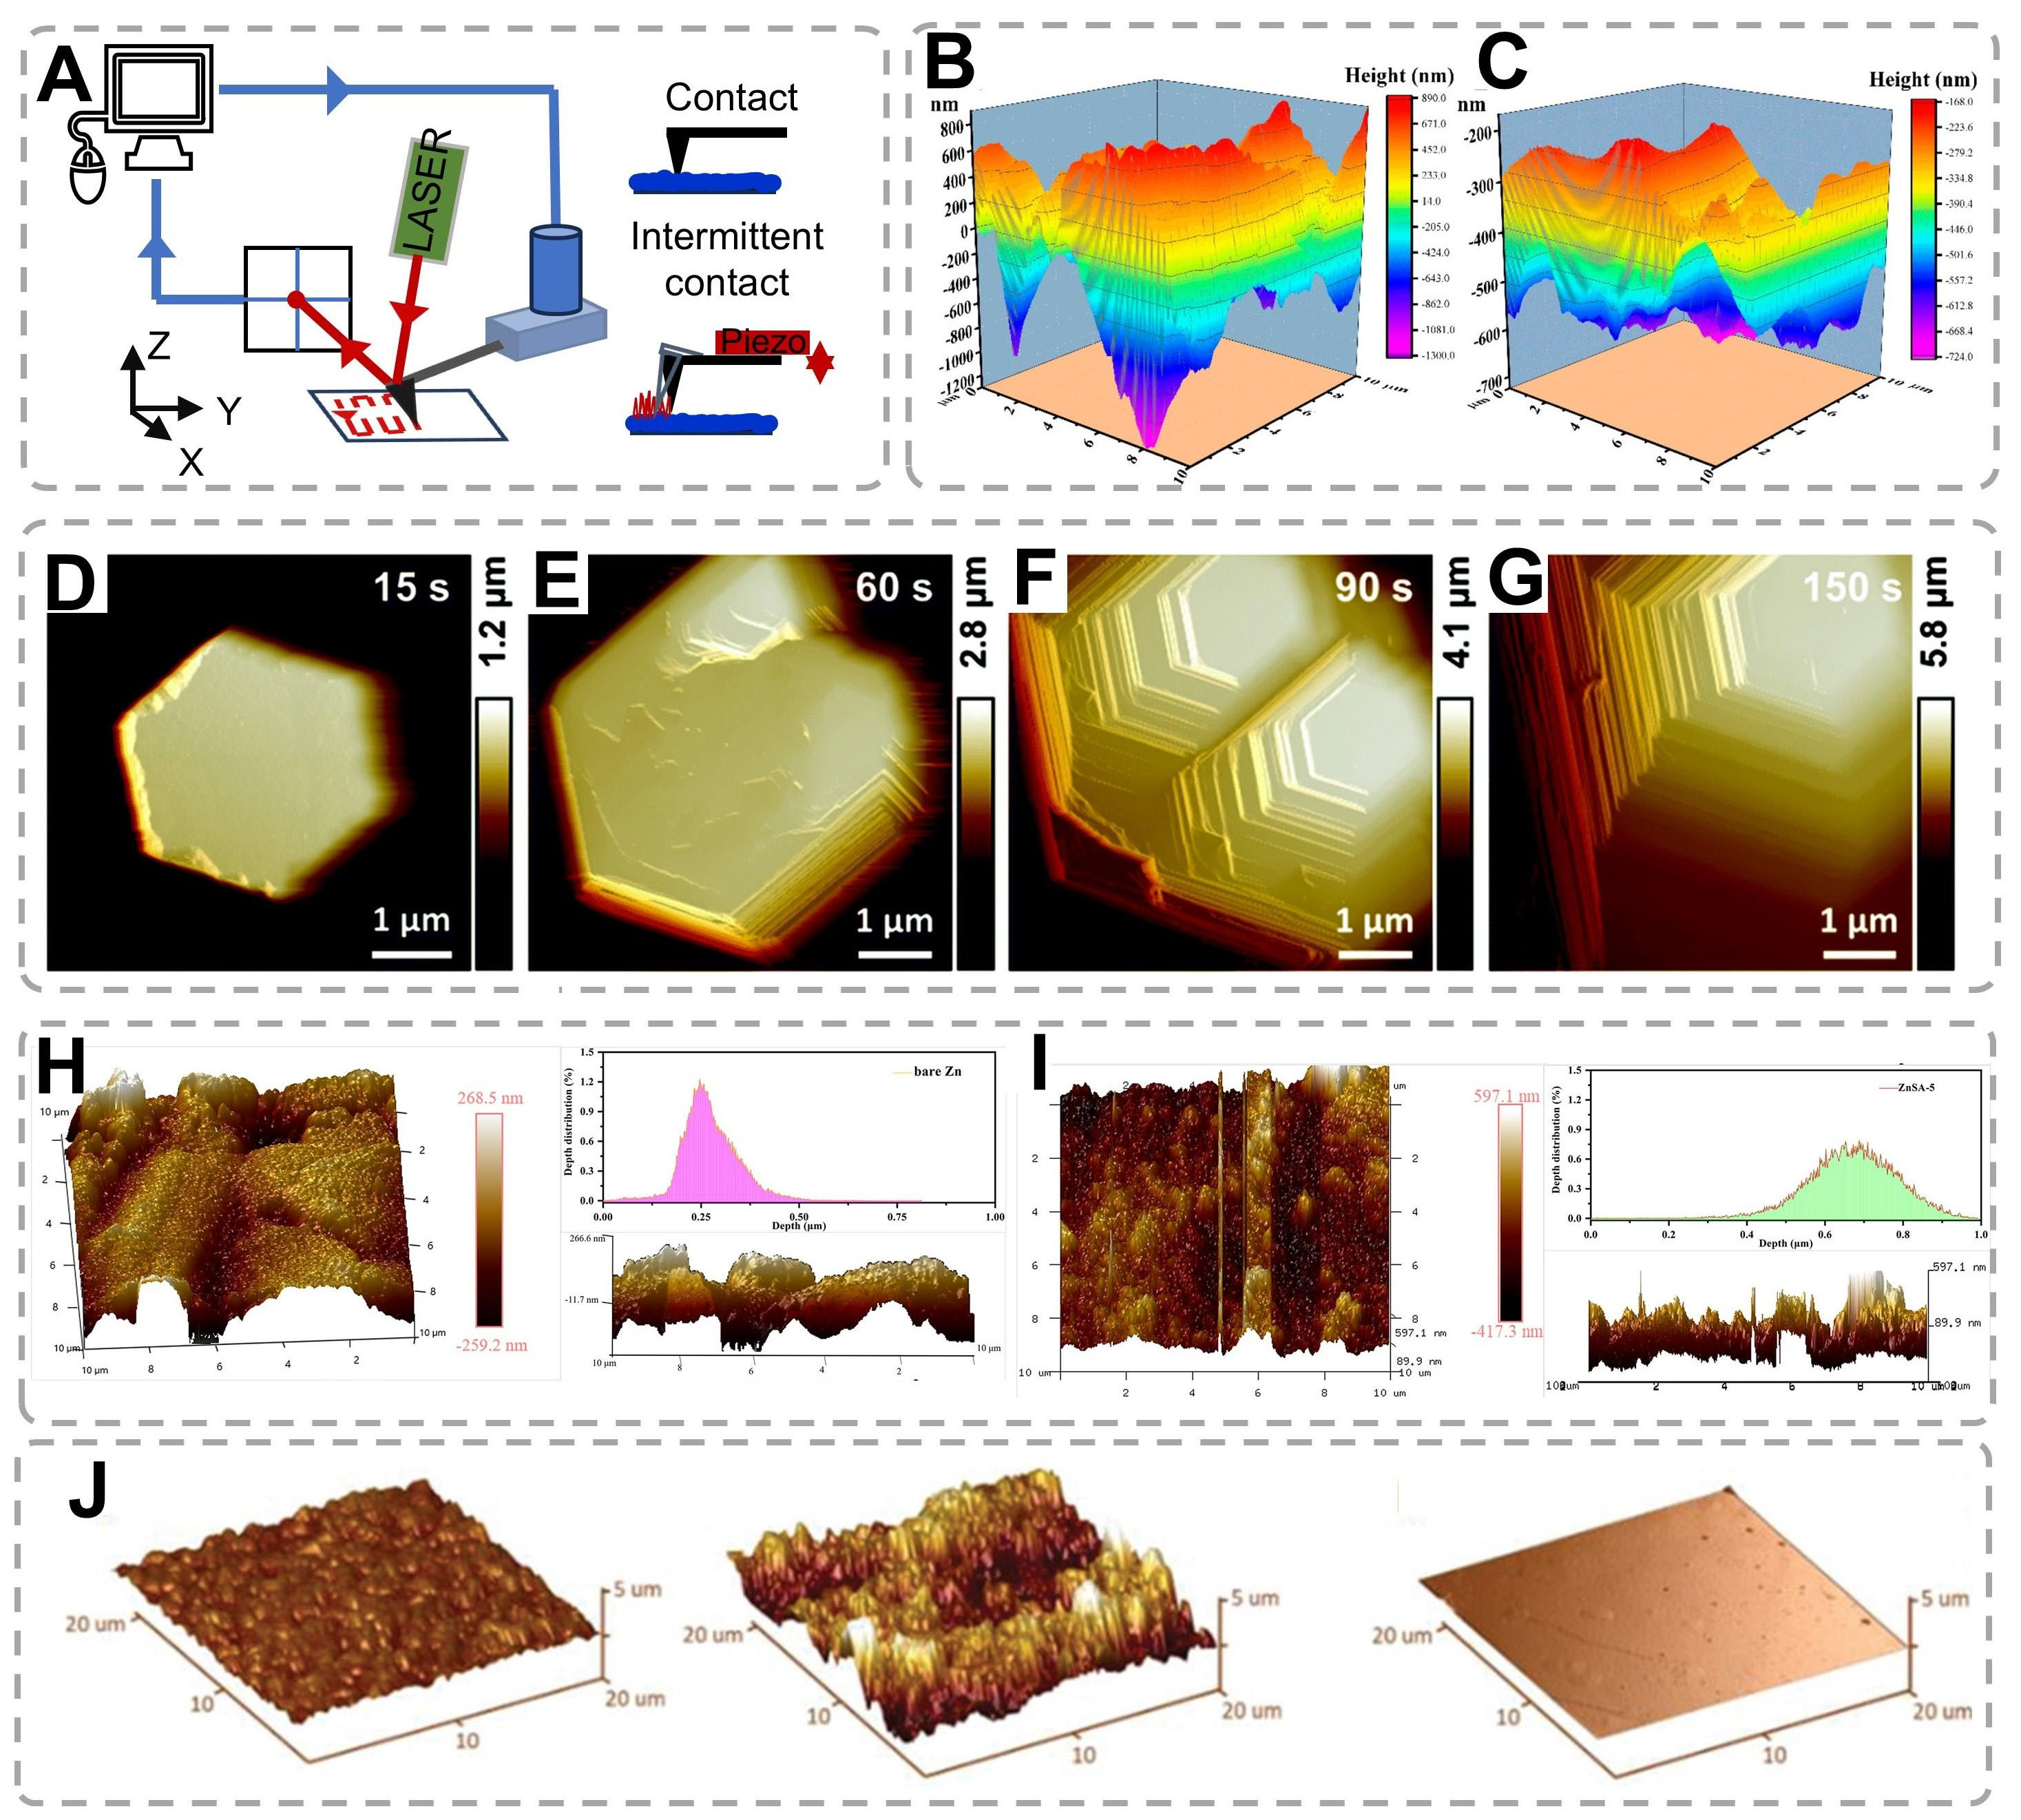
Figure 6. (A) Schematic diagram of AFM instrument. (B and C) AFM images of (B) standard Cu foil and (C) Cu (100) foi. (B and C) are reproduced from Ref.[53]. with permission, Copyright 2022, American Chemical Society. (D-G) In situ AFM images of Zn electrodeposits on HOPG under a current of 10 mA cm-2 in 0.5 M electrolyte[103,118]. Copyright 2022, Royal Society of Chemistry. (H and I) Surface and cross-sectional 3D AFM images (10 μm × 10 μm) and depth distributions of bare (H) Zn and (I) ZnSA-5[119]. Copyright 2022, Wiley. (J) AFM surface profiles of Zn plated on stainless steel, Poly-Zn, and Single-Zn[120]. Copyright 2022, Wiley.


