


fig5
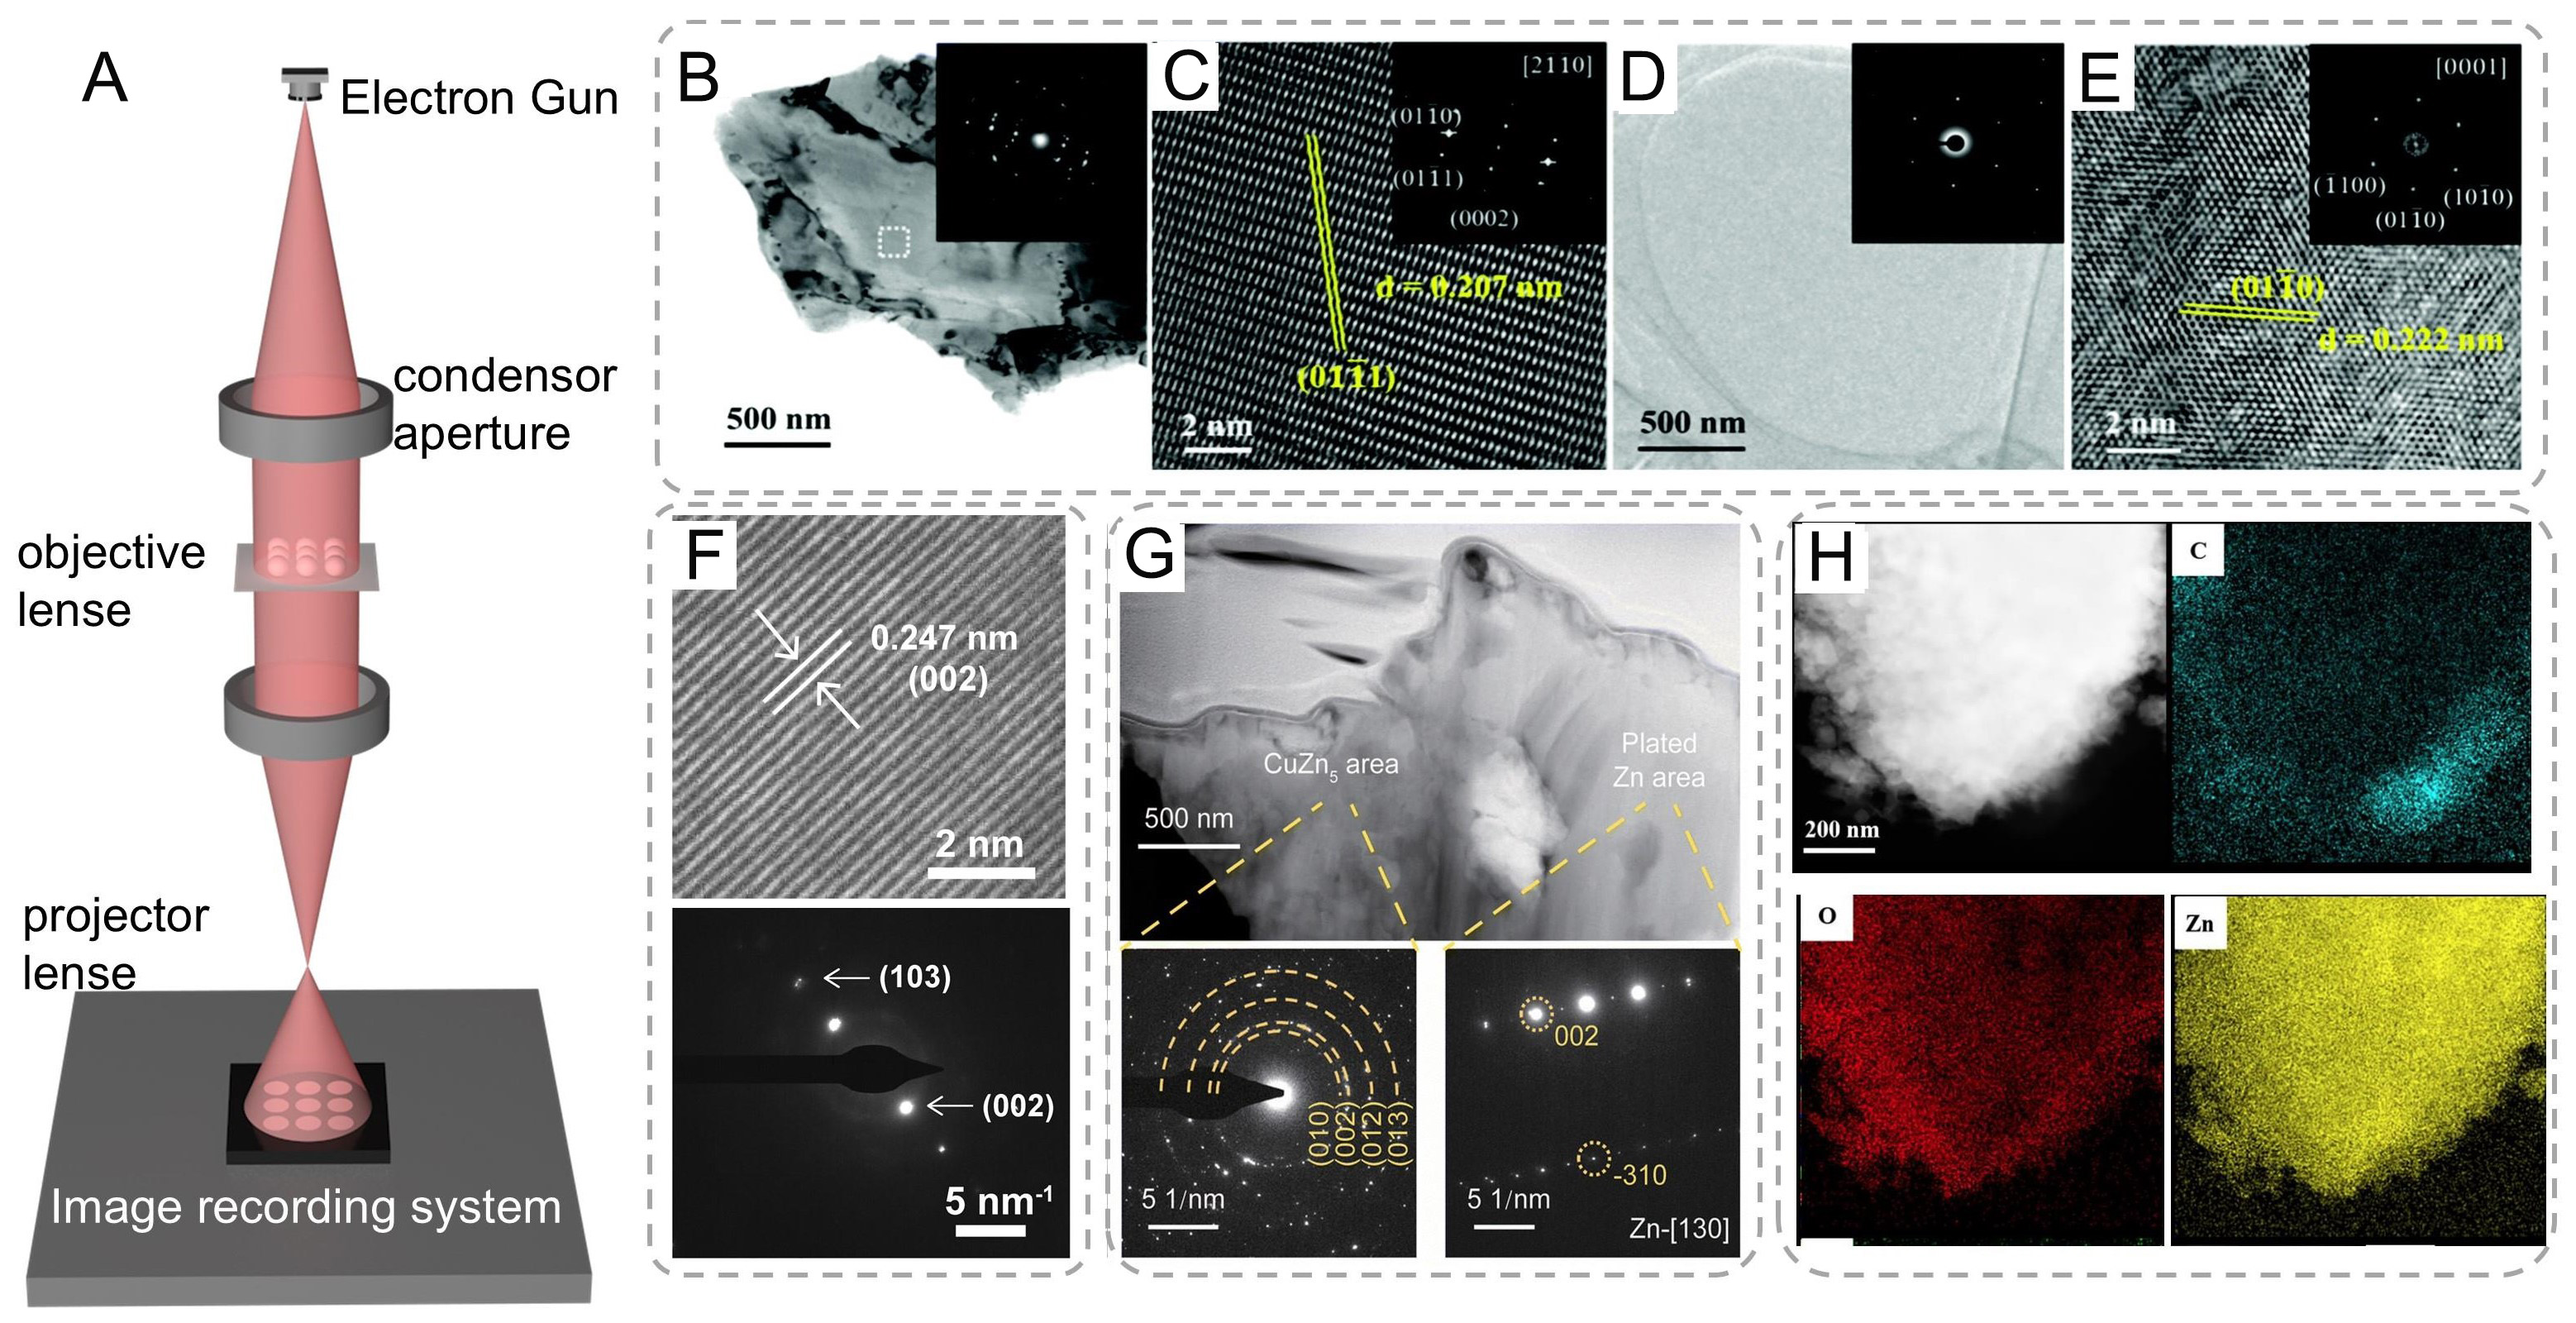
Figure 5. (A) Schematics of TEM equipment. (B) BF TEM and (C) HRTEM images of commercial Zn foil; (D) BF TEM and (E) HRTEM images of the protected Zn foil after Zn plating (the corresponding SAED patterns are shown in the insets). (A-E) are reproduced from Ref.[113]. with permission, Copyright 2021, Royal Society of Chemistry. (F) HRTEM image and SAED of deposited Zn in the electrolyte of 2 M Zn(TfO)2 with 0.5 M EMImTfO[39]. Copyright 2024, National Academy of Sciences. (G) The cross-sectional FIB-STEM images of Cu2+-Zn@Cu0.7Zn0.3 after 50 cycles. The corresponding SAED patterns of the CuZn5 area and plated Zn area are displayed[114]. Copyright 2025, Royal Society of Chemistry. (H) TEM image of the plated Zn electrode and the corresponding energy-dispersive X-ray spectroscopy mapping of carbon (C), oxygen(O), and zinc (Zn)[65]. Copyright 2024, Springer Nature.


