


fig4
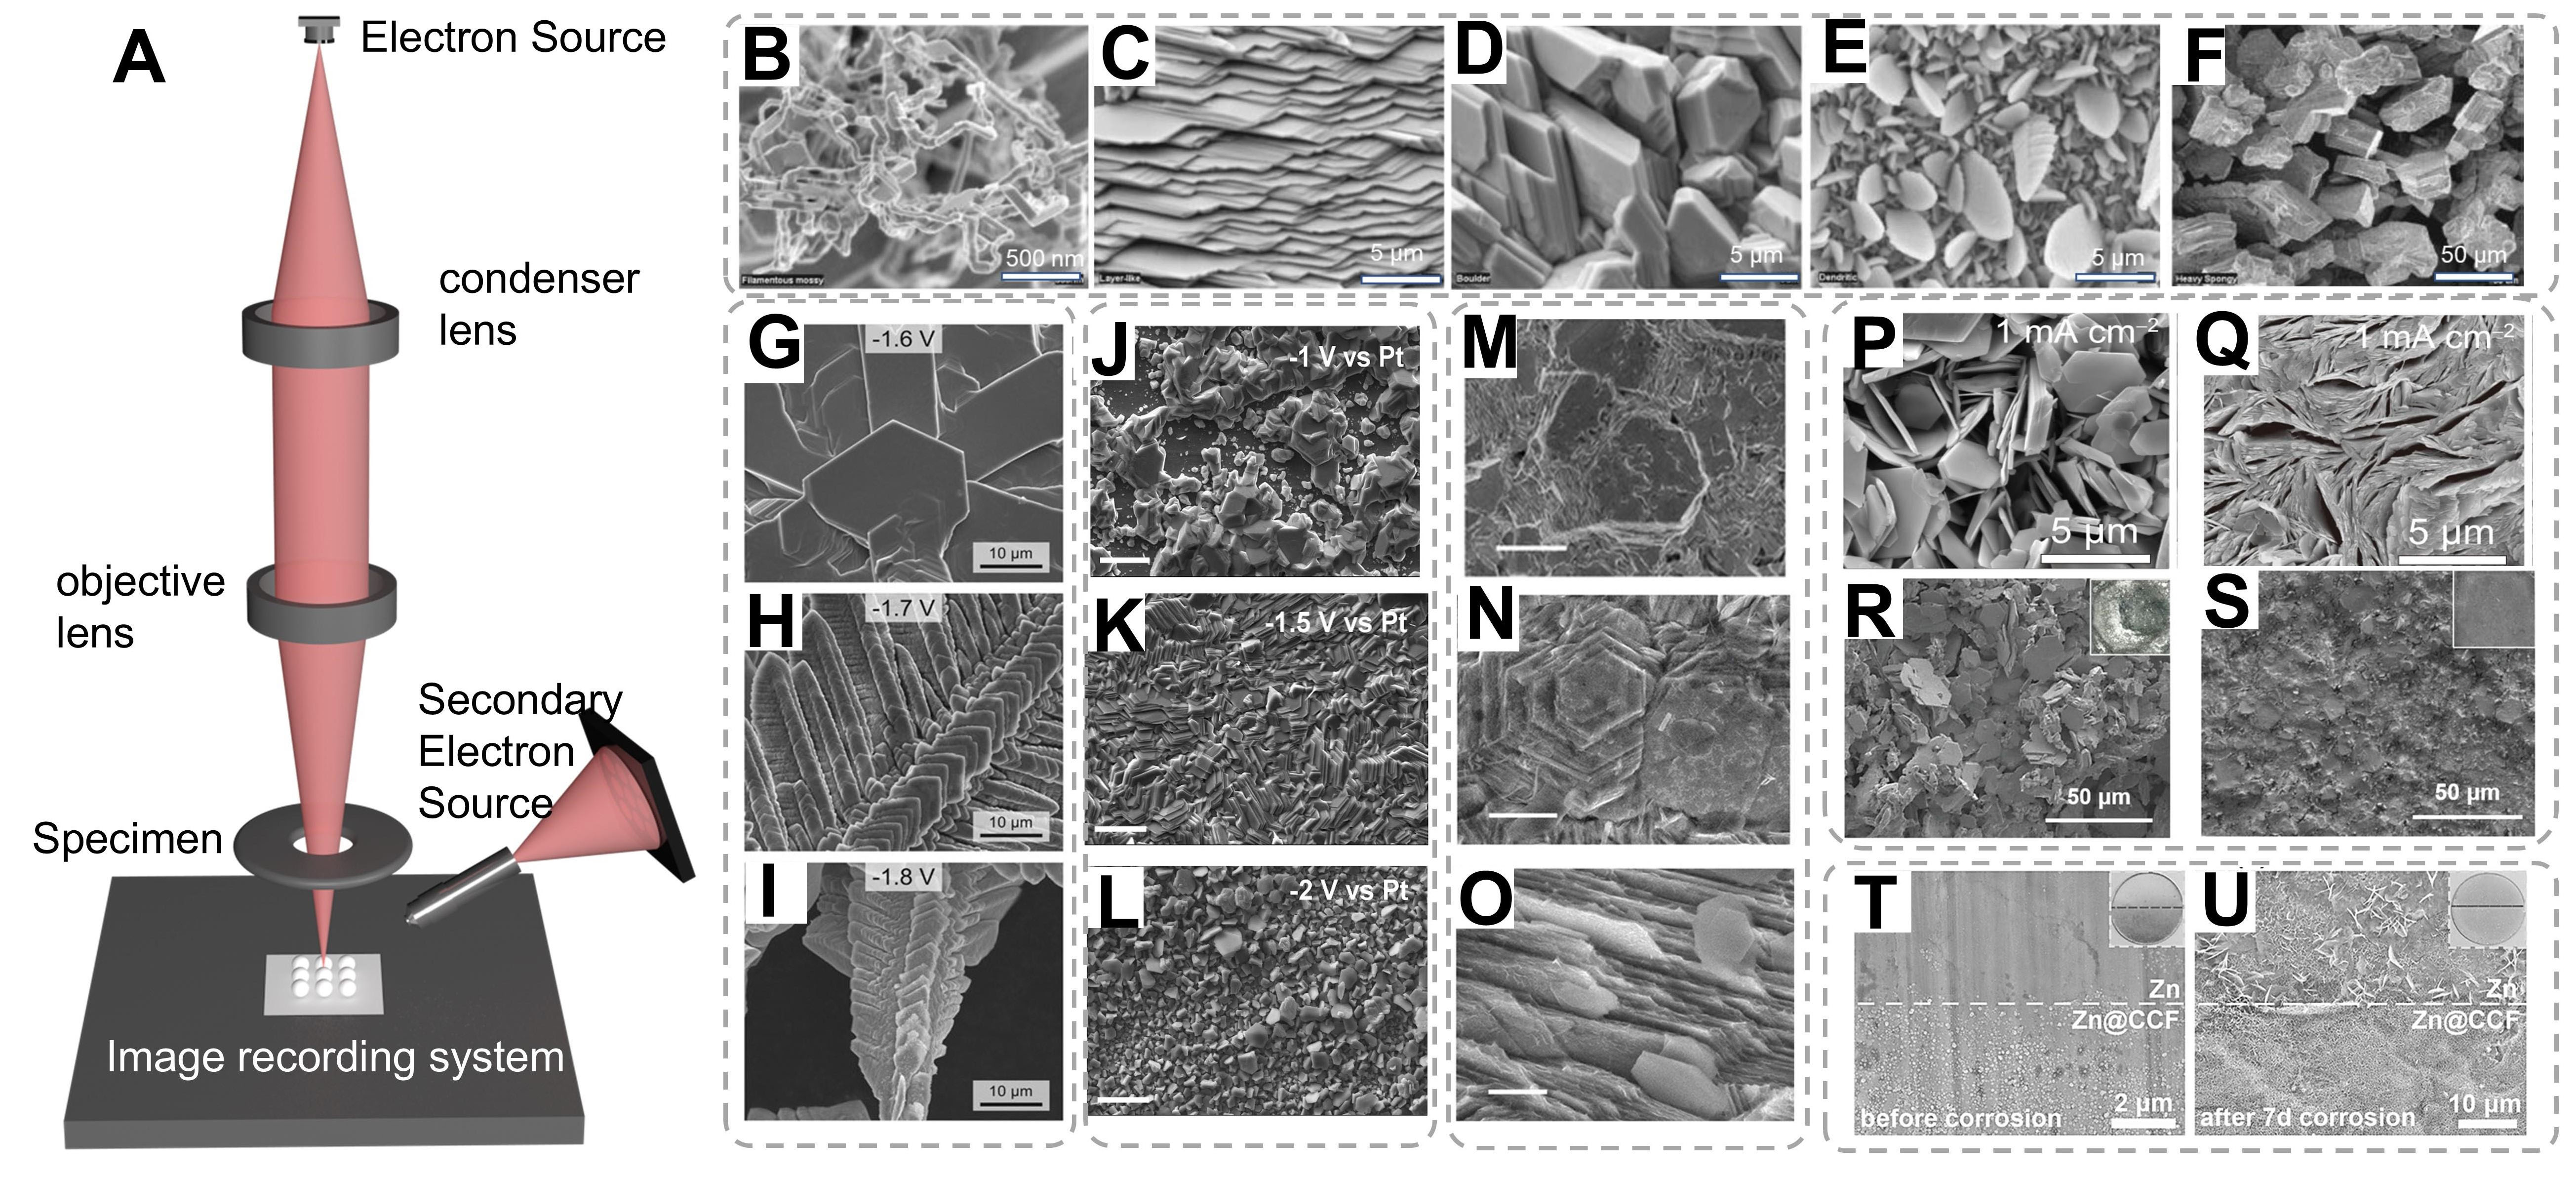
Figure 4. (A) Schematic diagram of the SEM equipment. (B-F) SEM images of five distinct Zn deposit morphologies. (B-F) are reproduced from Ref.[99]. with permission, Copyright 2006, Electrochemical Society. (G-I) SEM images of electrodeposited Zn in alkaline solution at different voltages[100]. Copyright 2015, Springer Nature. (J-L) SEM micrographs of Zn electrodeposits at different deposition potentials from ethylene glycol solution containing 0.75 M zinc acetate and 0.5 M sodium acetate[103]. Copyright 2019, Elsevier. (M-O) SEM image of the (002)/(101) Zn papers after cycling in Zn(OTf)2 or ZnSO4 at 1 mA cm-2 and 10 mA cm-2, respectively[102]. Copyright 2022, Wiley. (P-S) The SEM images of Zn deposits from the Zn electrodes of Zn||Zn cells with a fixed areal capacity of 1 mAh cm-2 in ZS and La3+-ZS electrolytes[106]. Copyright 2022, Springer Nature. (T and U) Digital and SEM images of bare Zn and Zn@CCF (T) before and (U) after 7 d of corrosion[109]. Copyright 2021, Wiley.


