


fig11
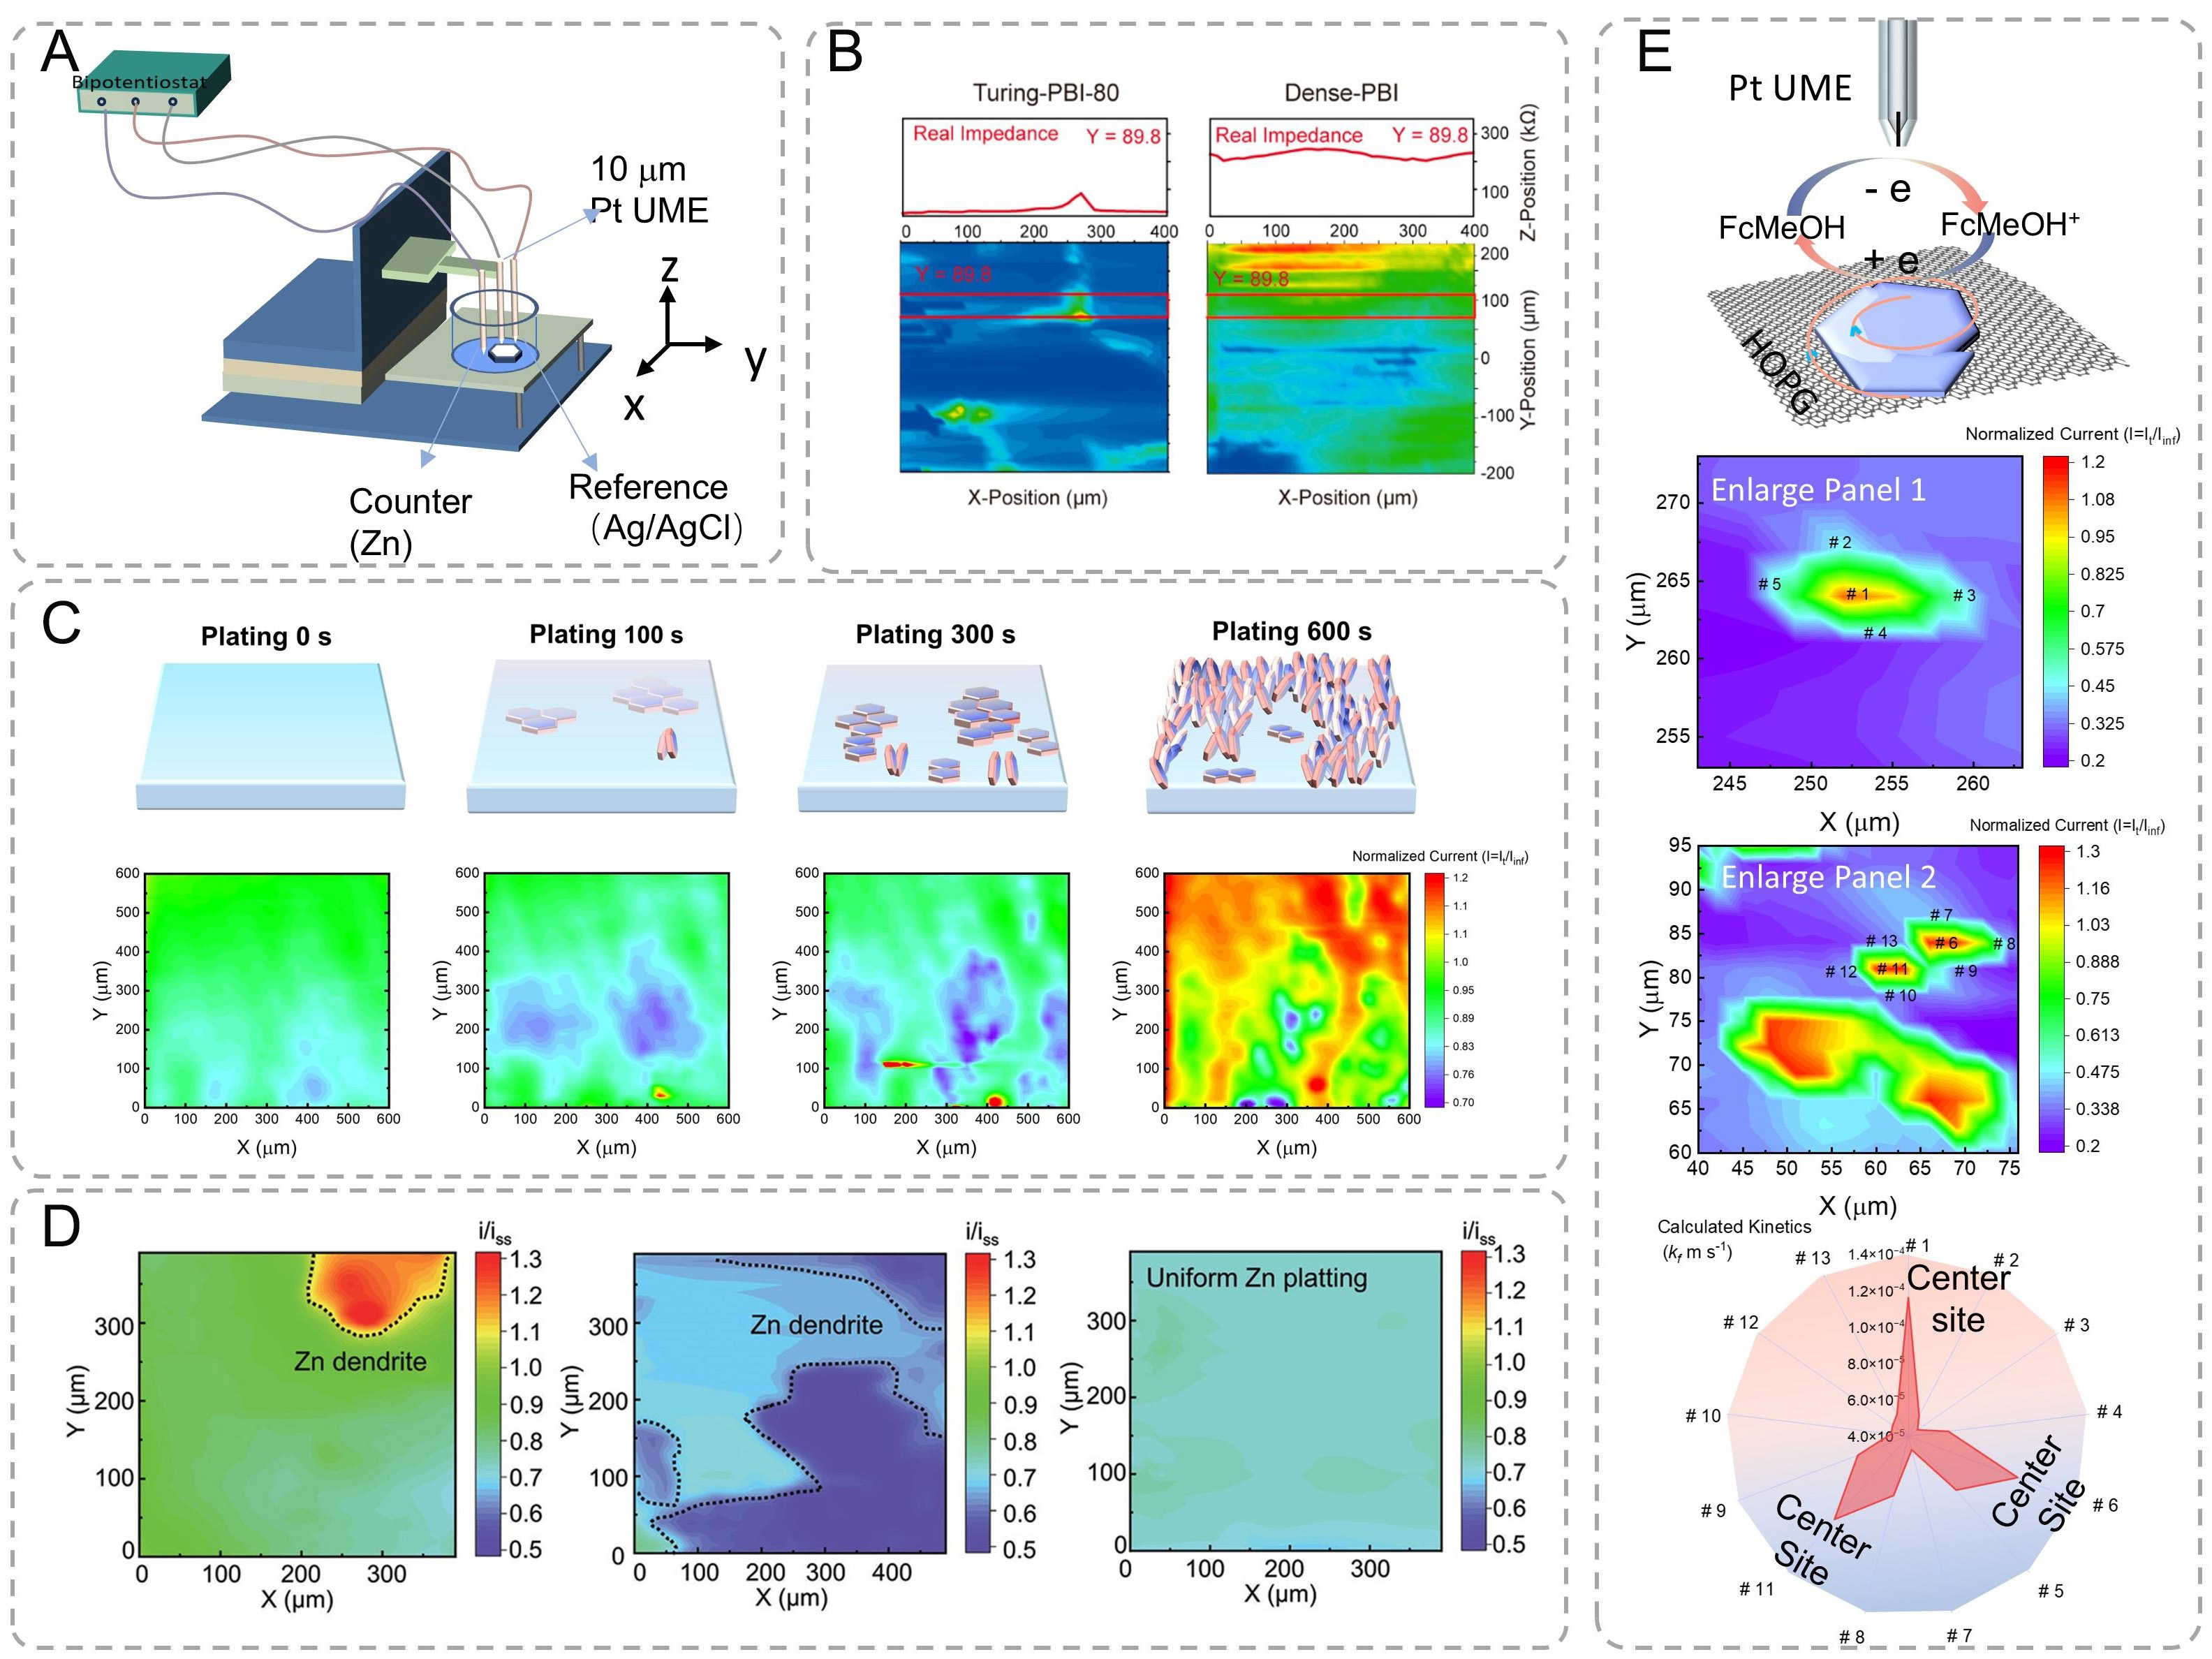
Figure 11. (A) Schematic diagram of scanning electrochemical microscope (SECM). (B) The membrane micro area resistance of Turing-PBI-80 and Dense-PBI was characterized by SECM[143]. Copyright 2022, American Chemical Society. (C) Schematic illustration and SECM feedback images of Fre-Zn electrodeposition behavior at various plating durations, including 0s, 100, 300, and 600 s[144]. Copyright 2023, Wiley. (D) SECM image of different after plating 300/3,600 s[145]. Copyright 2022, Wiley. (E) SECM image and corresponding enlarged area of the Zn deposition sample with marked active sites and the corresponding kinetics[37]. Copyright 2025, American Chemical Society.


