

fig5
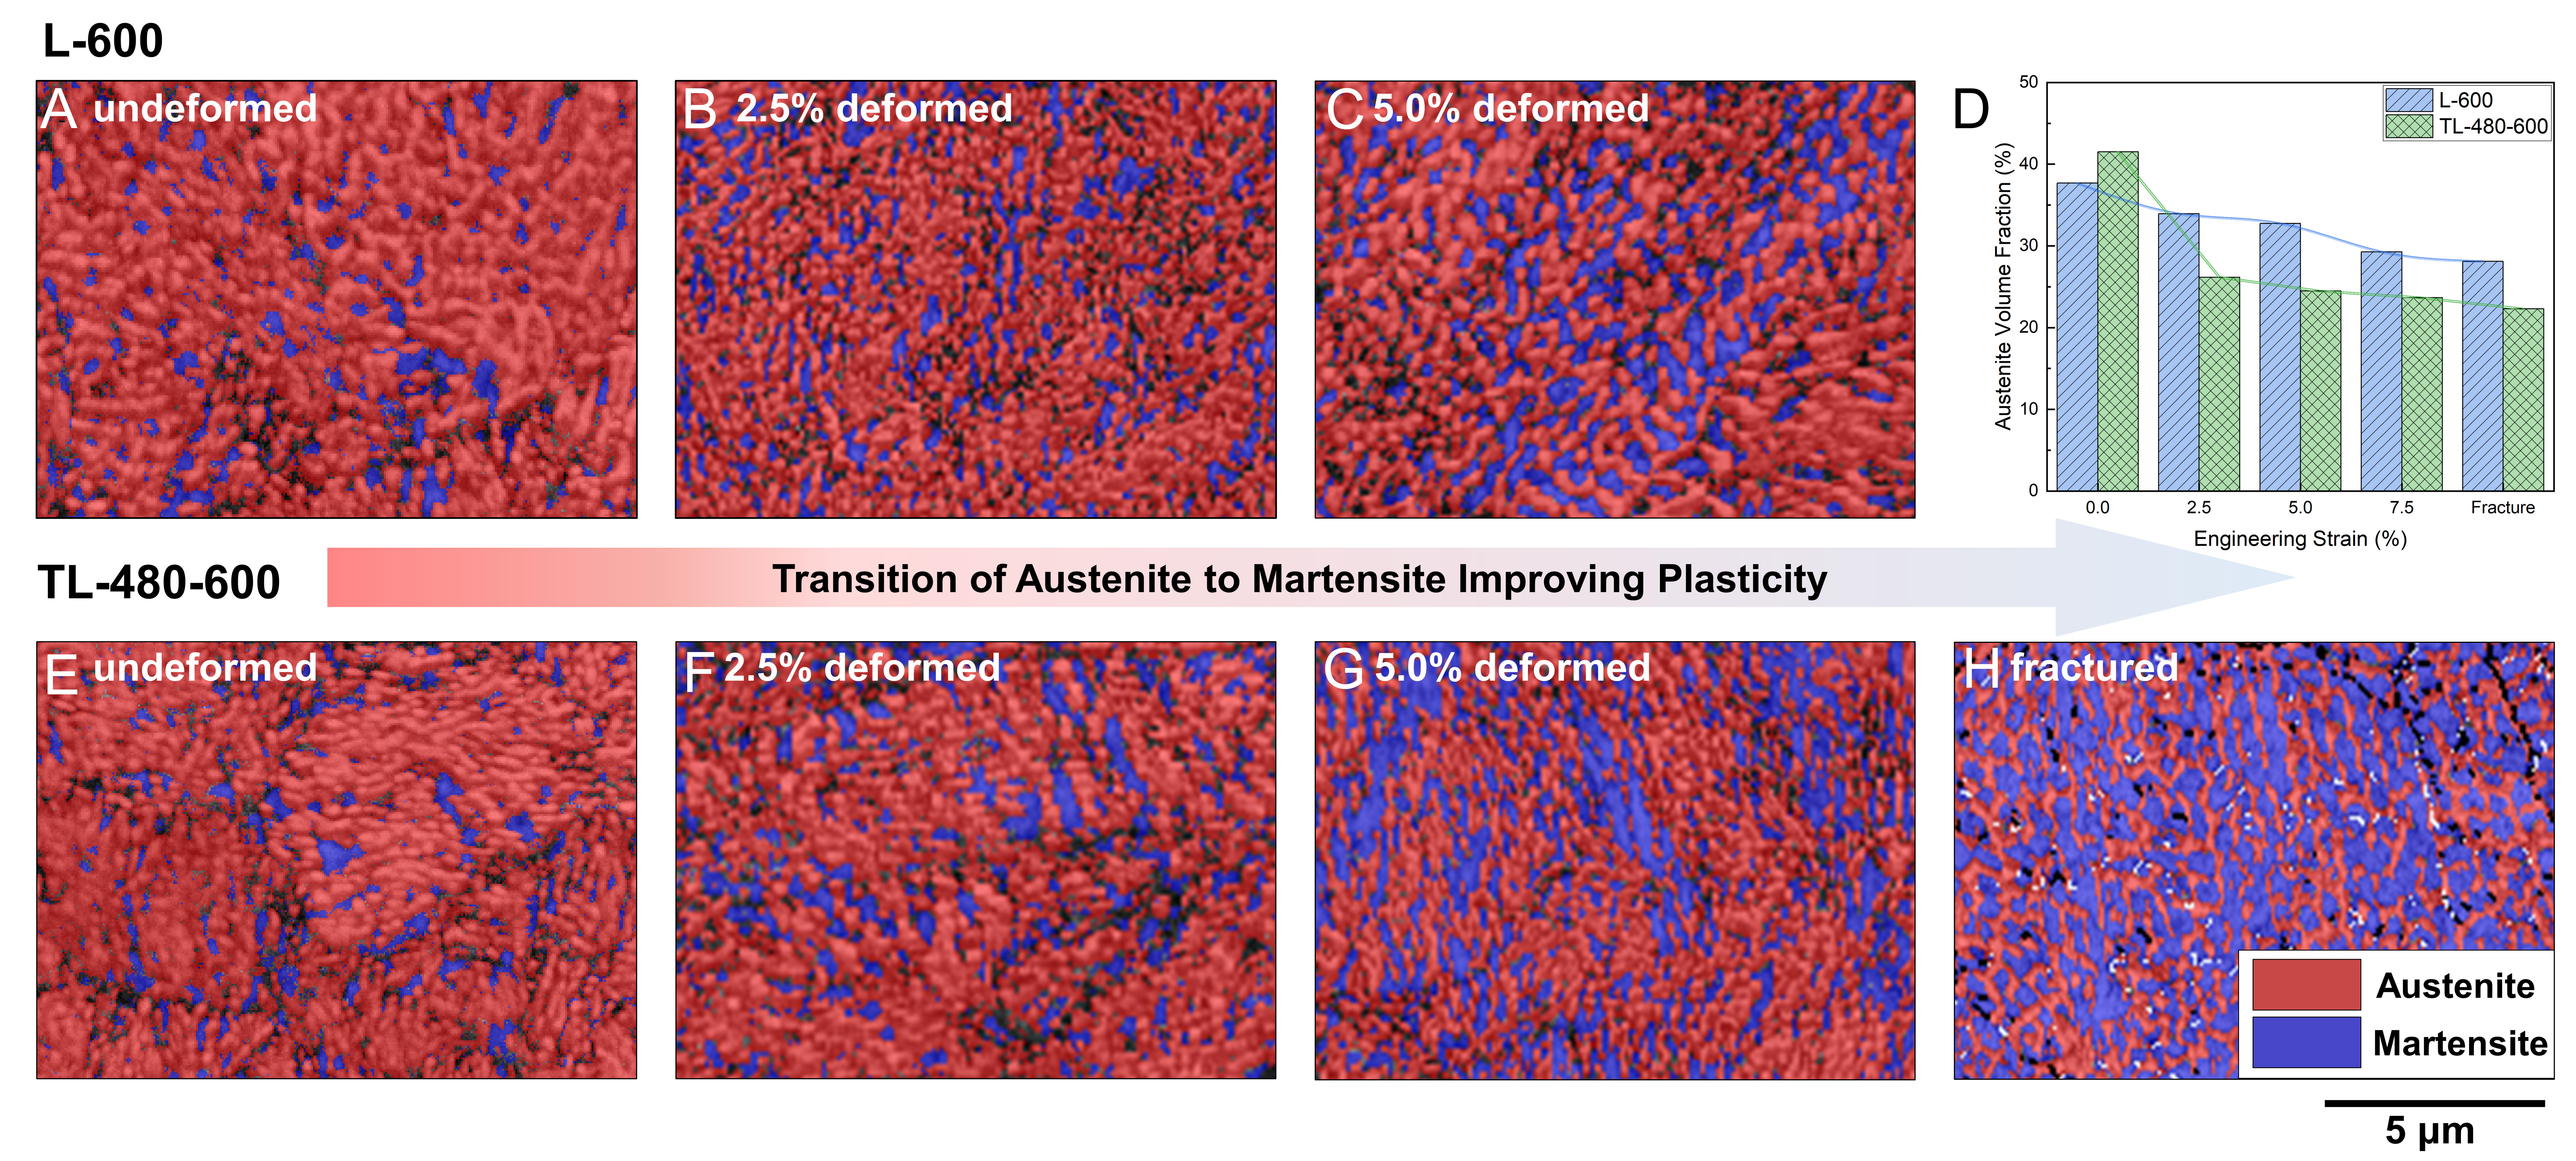
Figure 5. Serial ex-situ EBSD phase maps showing deformation-induced γ → α’ transformation at room temperature: (A-C) L-600 phase maps at 0%, 2.5% and 5.0% engineering strain; (E-H) TL-480-600 phase maps at 0%, 2.5% and 5.0% engineering strain, and after fracture; (D) Austenite volume fraction as a function of engineering strain measured by XRD. Austenite is shown in red and martensite in blue in the EBSD maps. Scale bar as indicated. EBSD maps were acquired from comparable locations (the same distance from the fracture surface) across strain states. EBSD: Electron backscatter diffraction; XRD: X-ray diffraction.





