

fig4
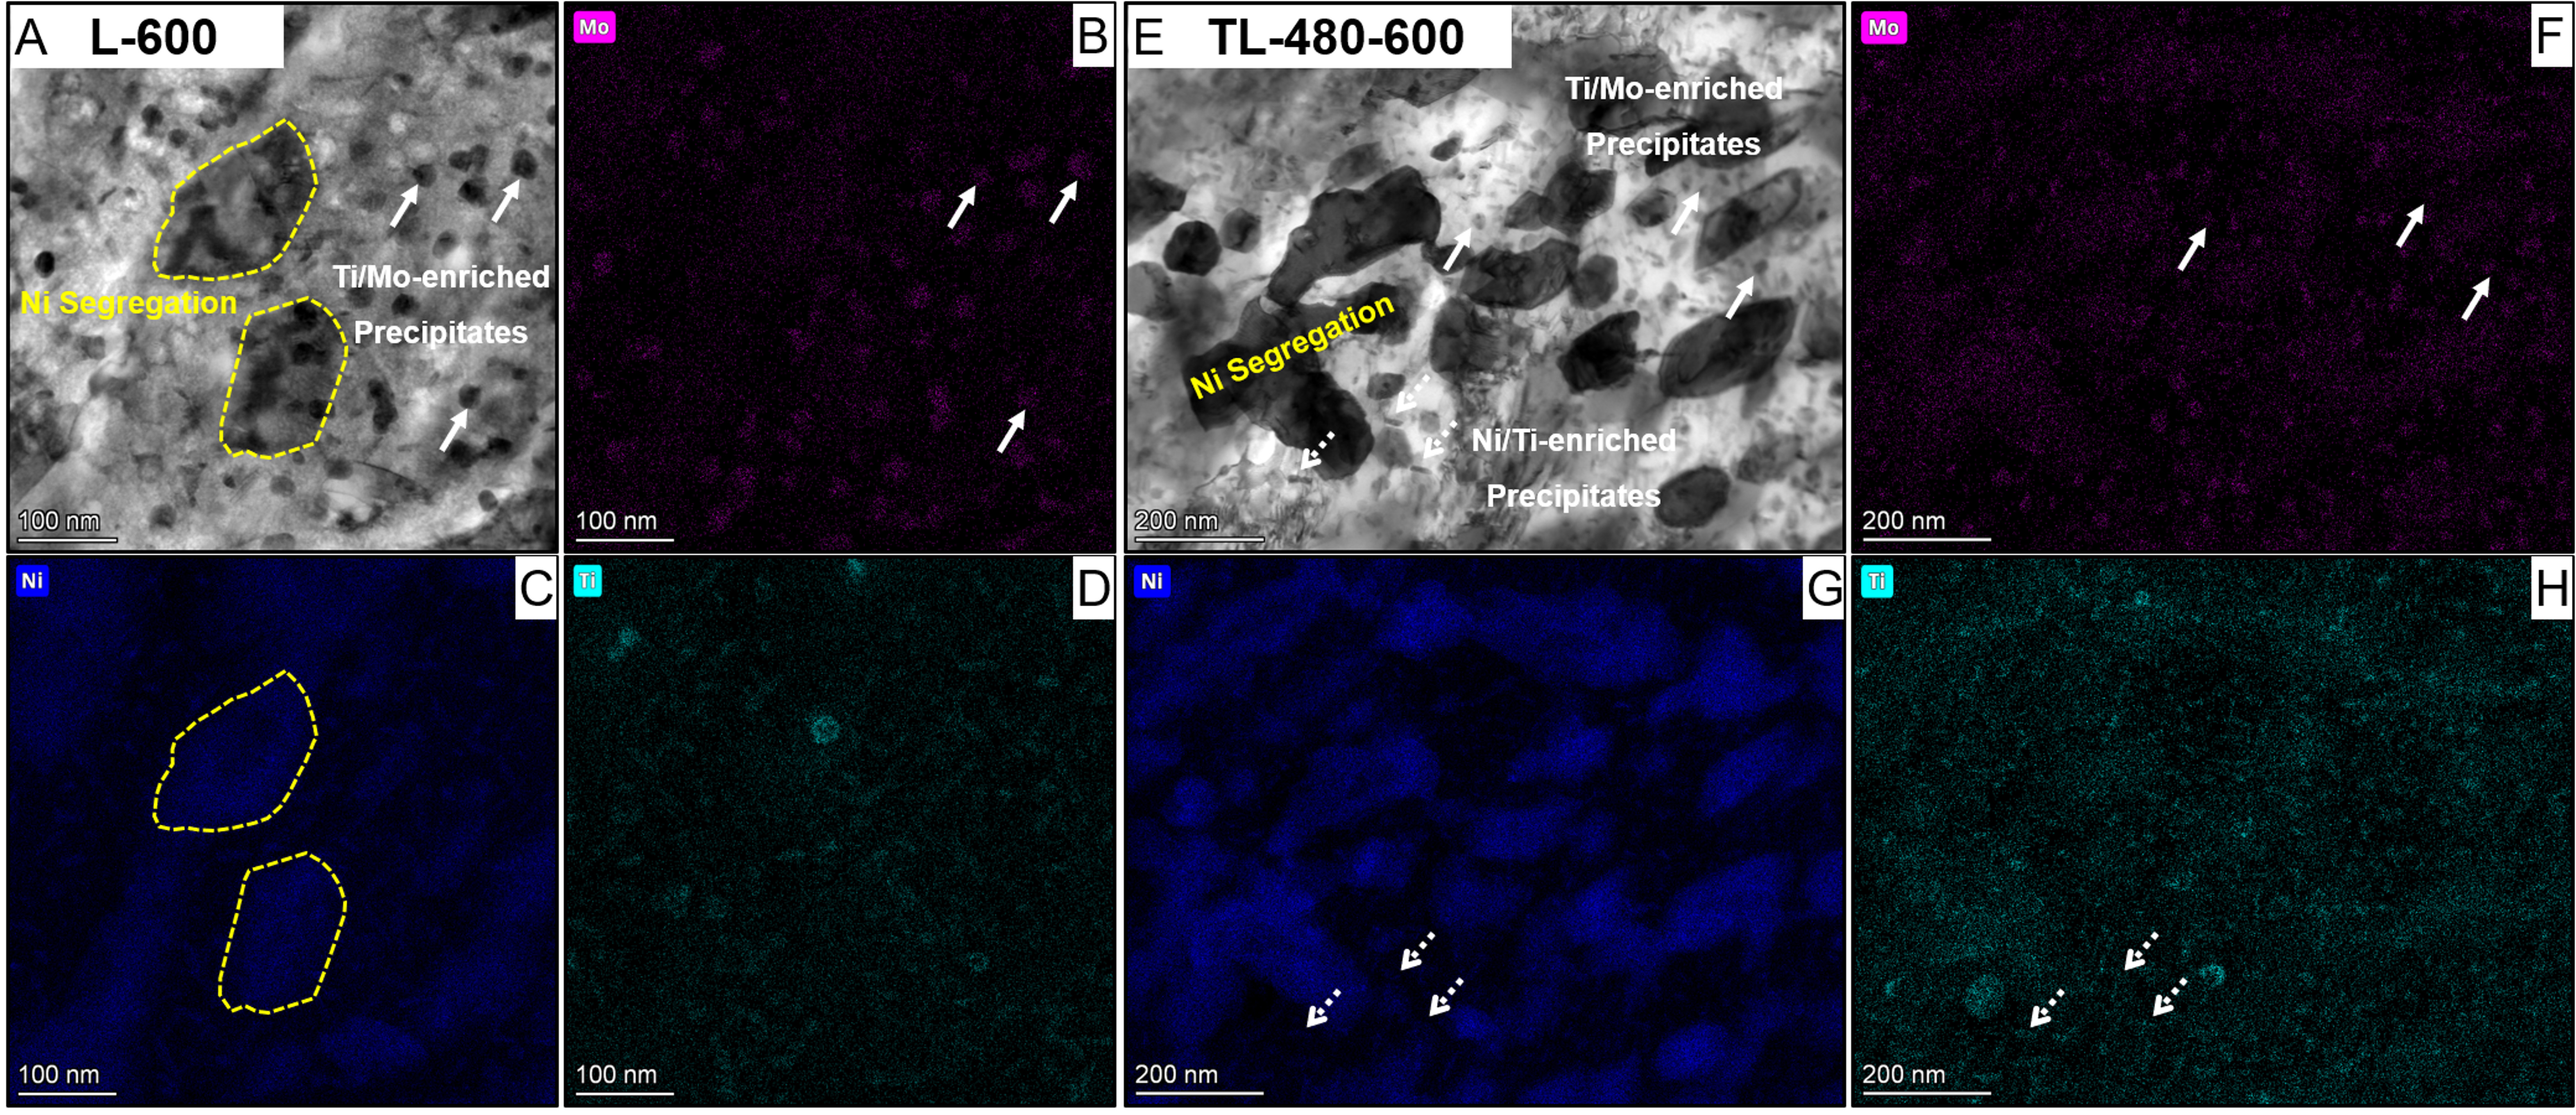
Figure 4. TEM-EDS evidence for precipitation and partitioning features in L-600 and TL-480-600: (A) L-600 electron micrograph; (B) Mo map, (C) Ni map, and (D) Ti map corresponding to (A); (E) TL-480-600 electron micrograph; (F) Mo map, (G) Ni map, and (H) Ti map corresponding to (E). Ni-enriched regions are outlined and Mo/Ti-enriched regions are marked by arrows. Scale bars as indicated. TEM-EDS: Transmission electron microscopy-energy-dispersive X-ray spectroscopy.





