


fig7
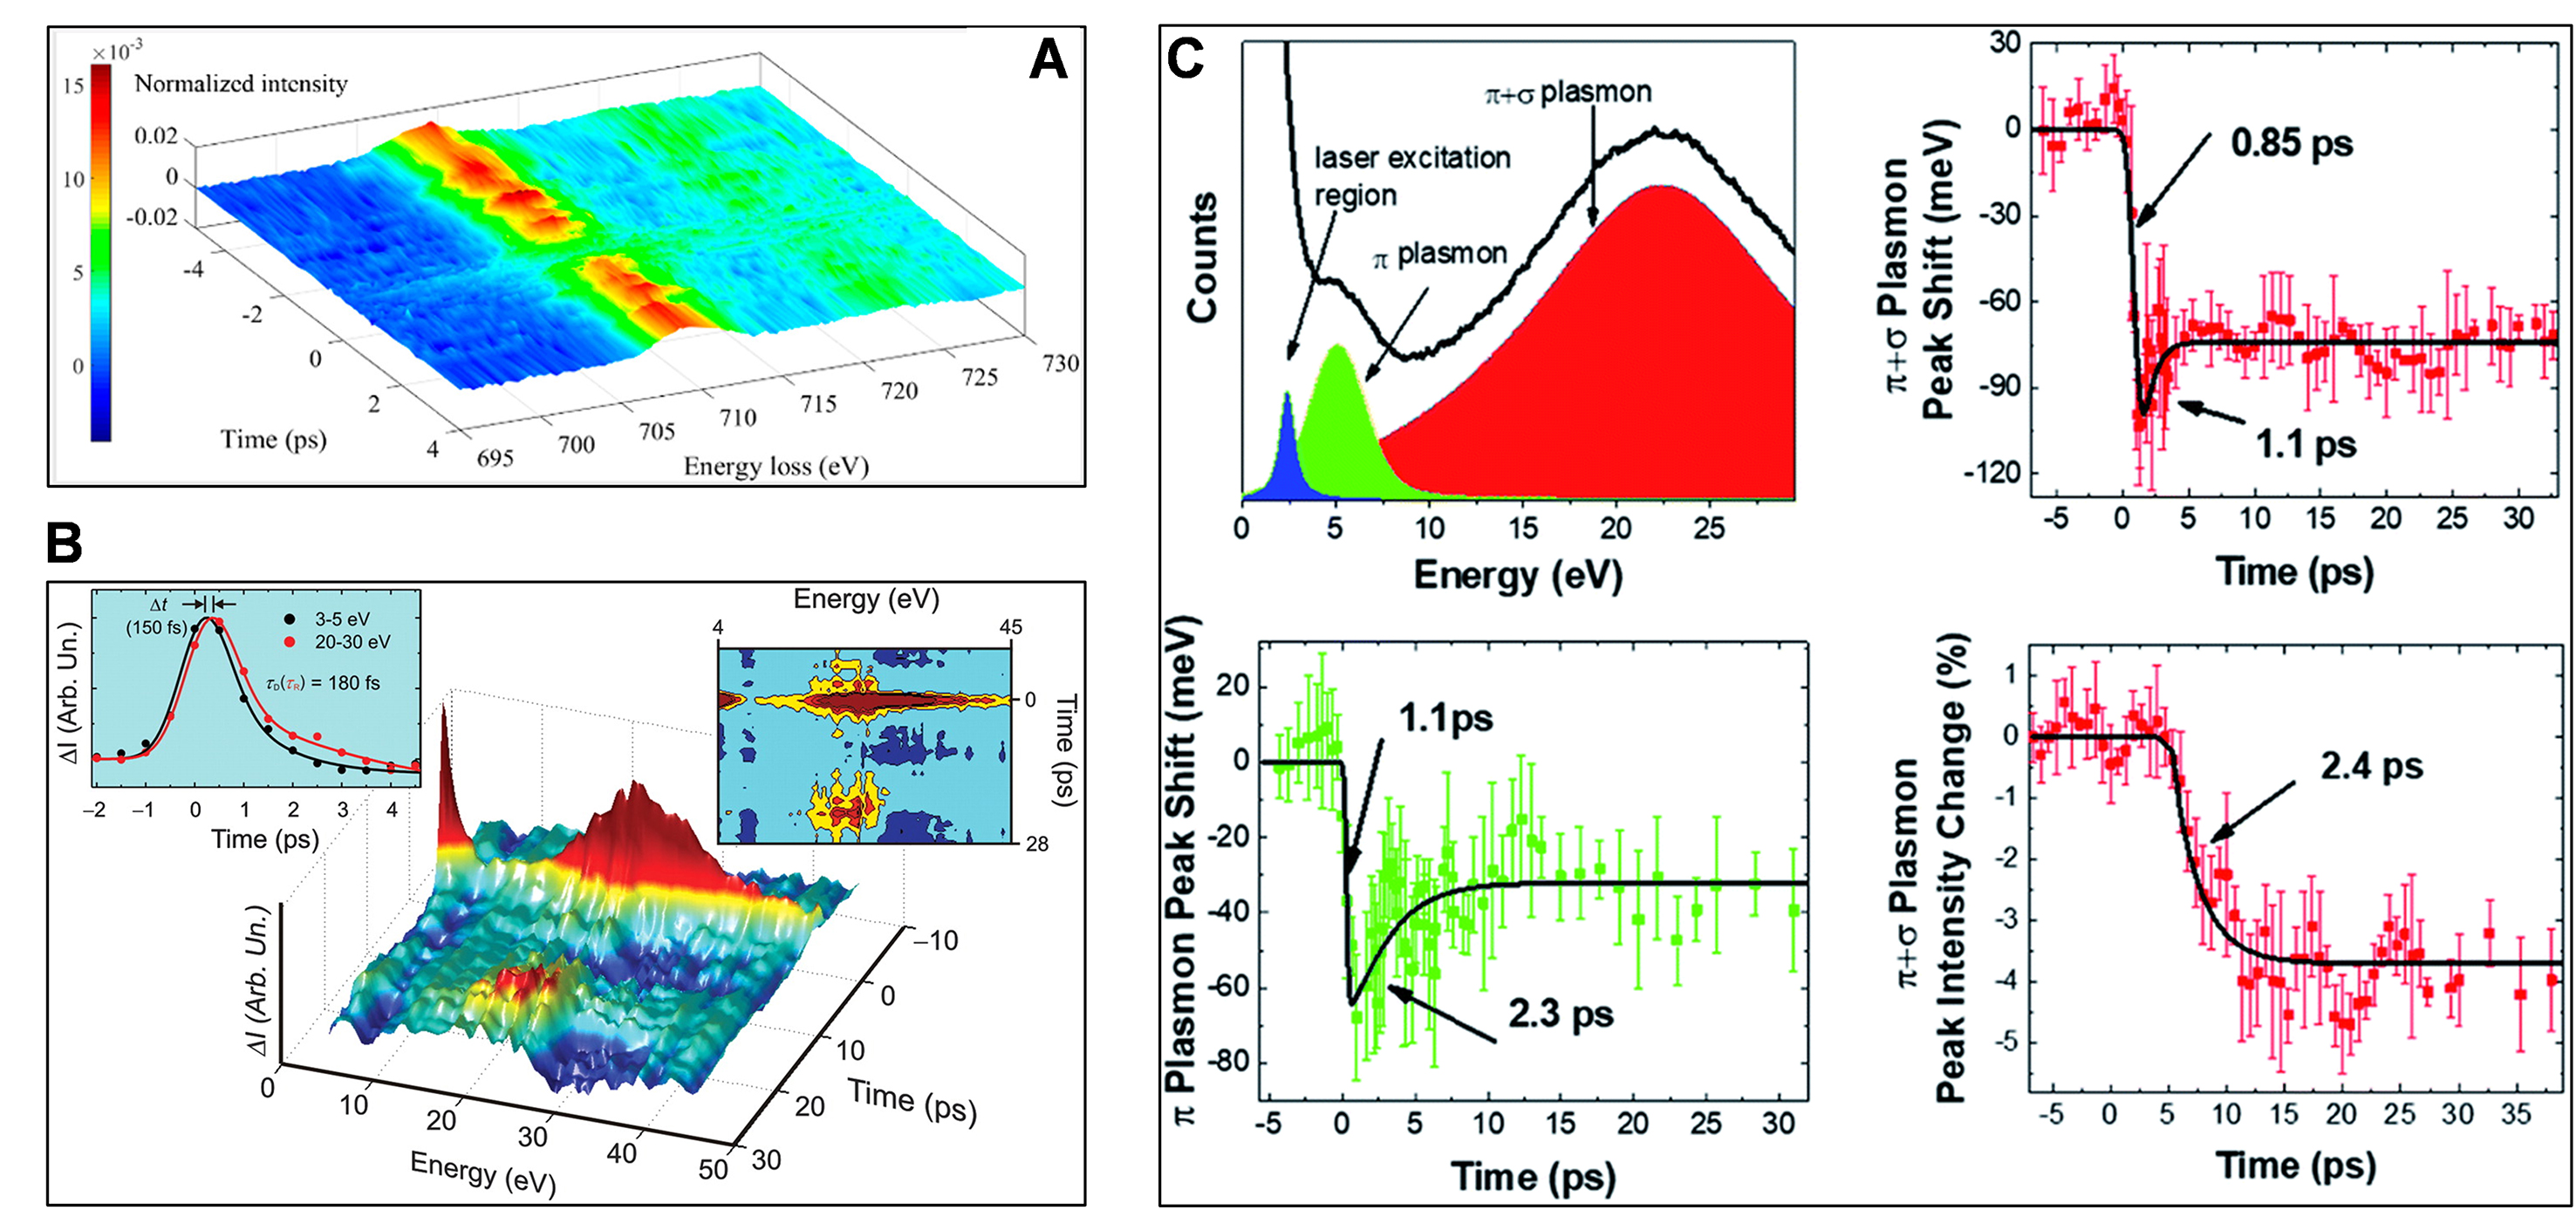
Figure 7. Ultrafast EELS and elemental valence analysis. (A) 3D intensity-energy-time EELS plot for graphite, showing the time-energy-amplitude evolution of the spectral changes at different time delays. Reprinted with permission[137]. Copyright 2009, AAAS. (B) 3D intensity-energy-time dynamics of the overall Fe L-edge EELS. Reprinted with permission[138]. Copyright 2017, American Chemical Society. (C) fs EELS of single-walled carbon nanotubes. Reprinted with permission[139]. (C) is reproduced under the CC BY-NC license.Copyright 2020, Royal Society of Chemistry.


