


fig5
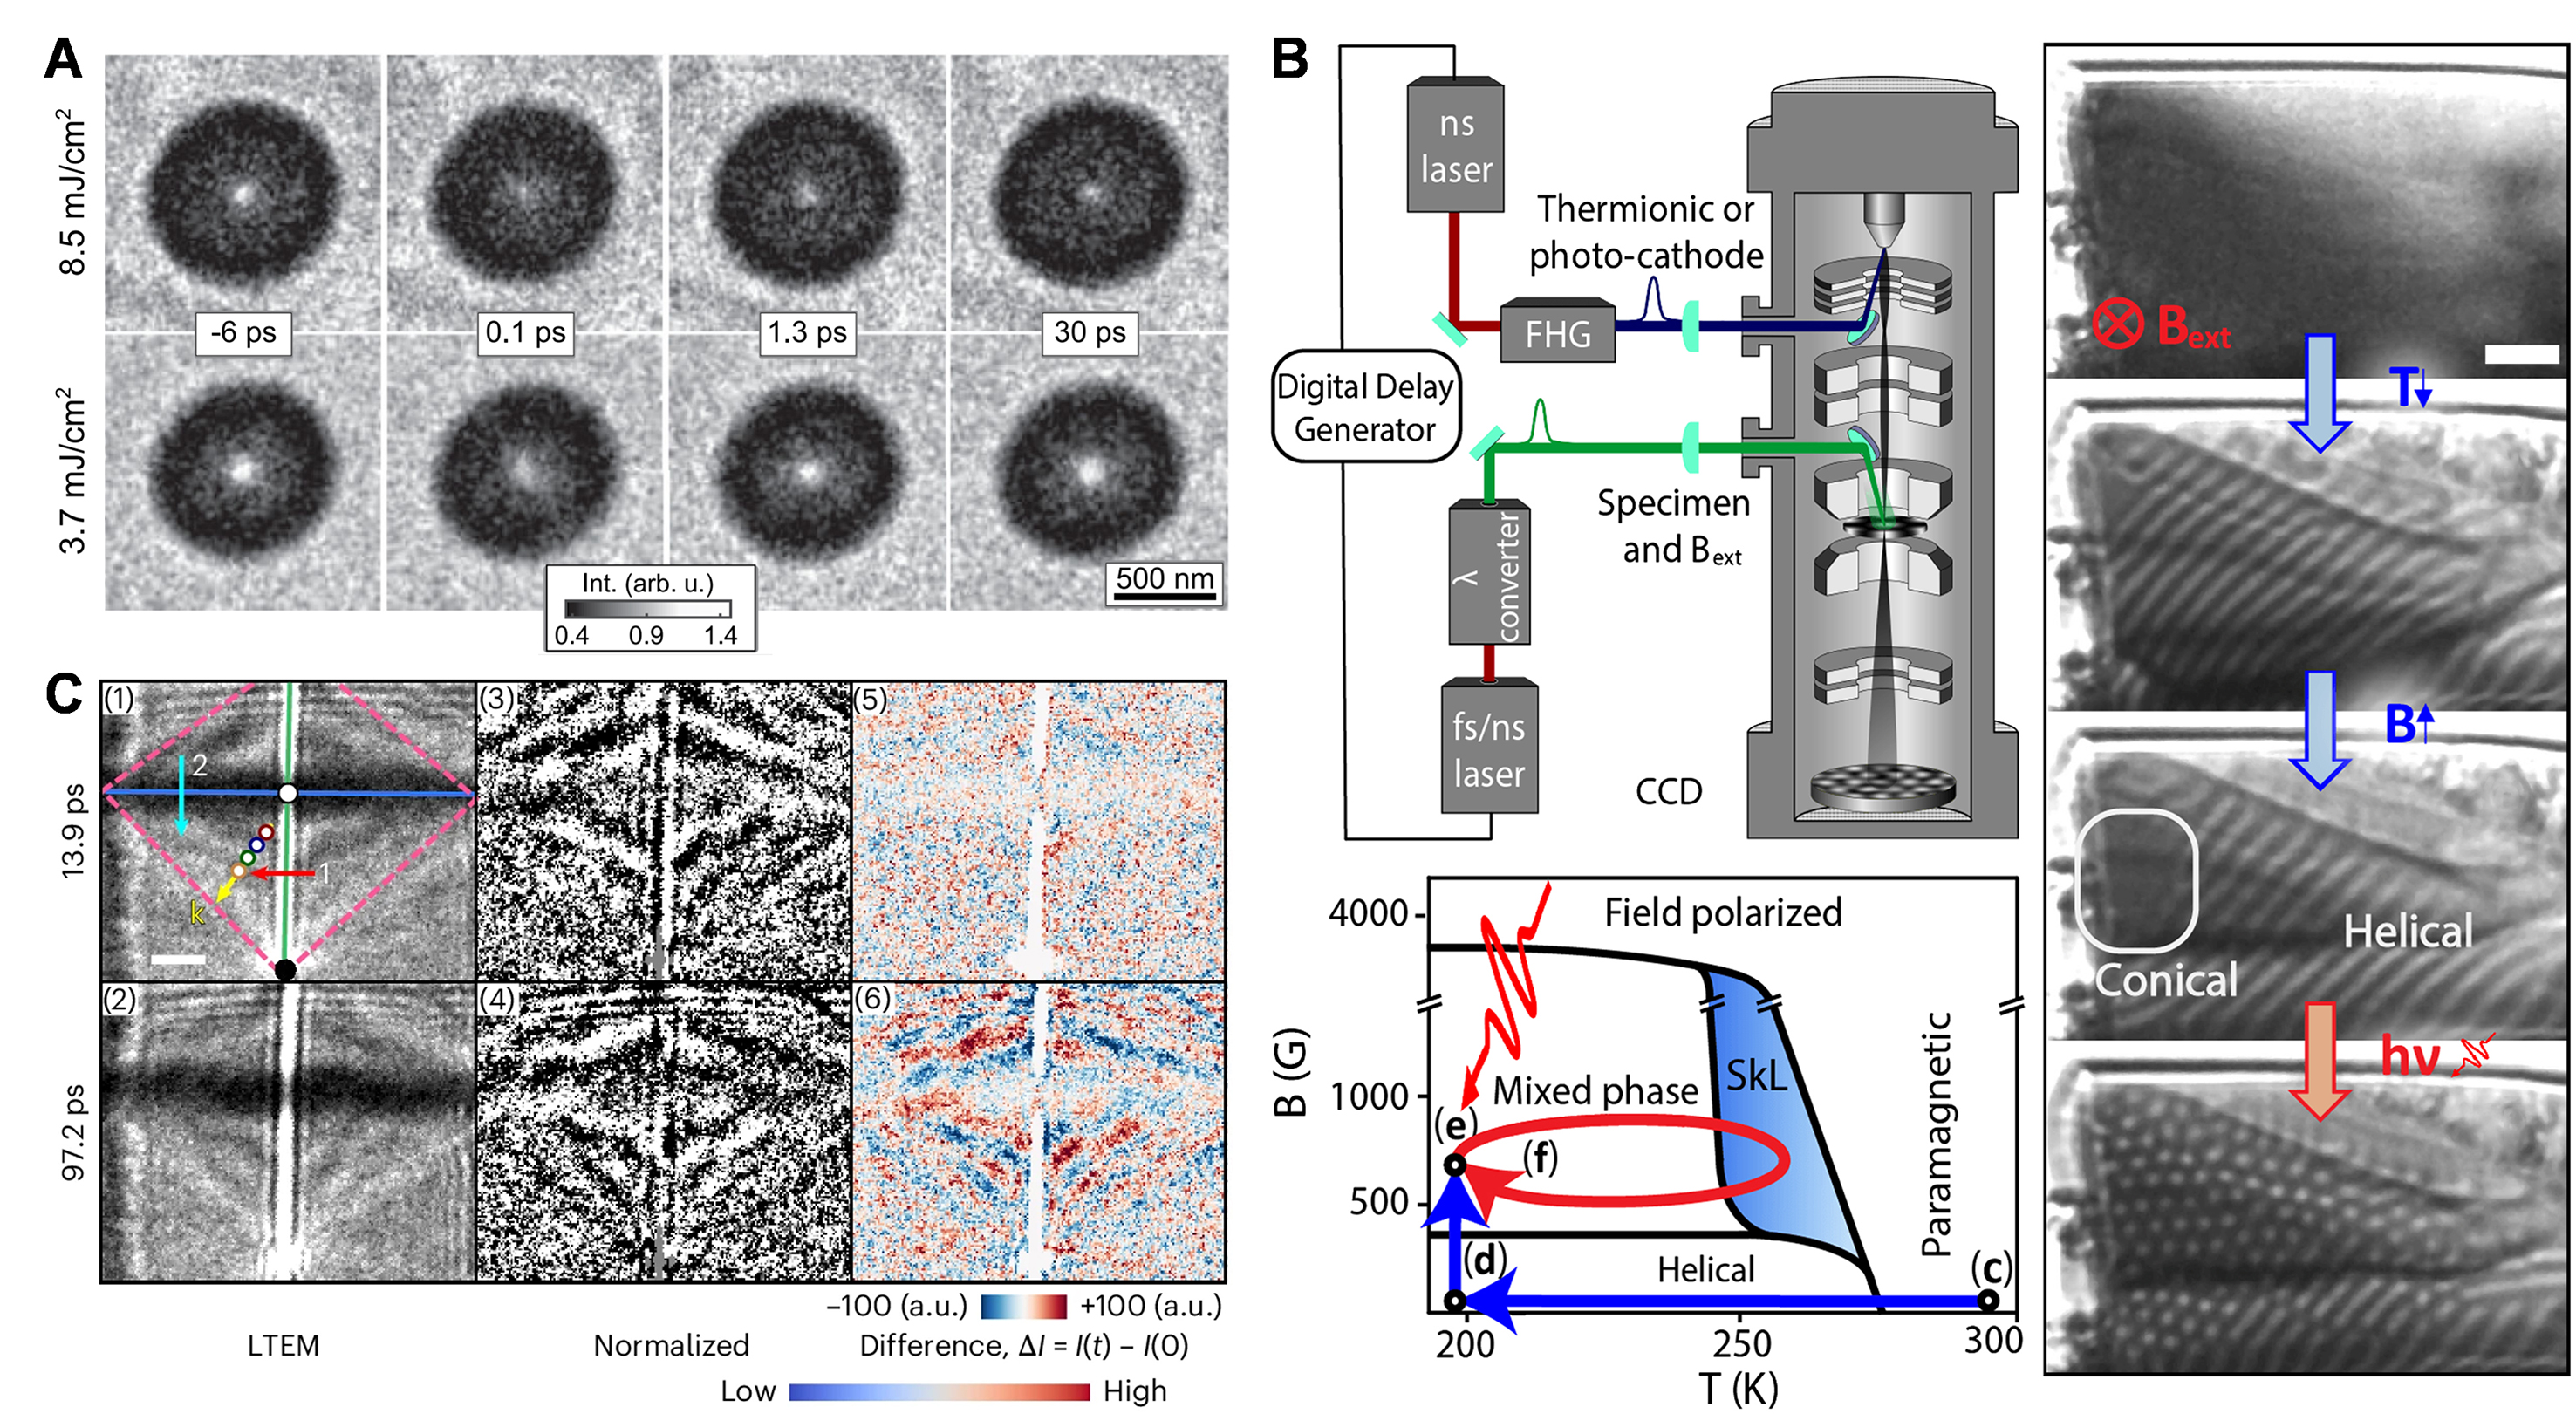
Figure 5. (A) Demagnetization process of a magnetic vortex observed by ultrafast LTEM. Reprinted with permission[127]. Copyright 2018, American Physical Society. (B) Schematic diagram of the light-induced generation process of a skyrmion. Top left: Schematic of the in-situ pump-probe cryogenic ultrafast LTEM experimental setup. Bottom left: Magnetic phase diagram of the FeGe nanoplates, arrows indicate key pathways within the phase diagram. Right: LTEM images of FeGe nanoplates under different conditions. The skyrmion lattice was generated by near-infrared fs laser pulses. Scale bar: 250 nm. Reprinted with permission[128]. Copyright 2018, American Physical Society. (C)Time-resolved ultrafast LTEM imaging of spin waves. Ultrafast LTEM images ((1) and (2)), intensity-normalized (to the averaged intensity by pixel) images ((3) and (4)), and difference images ((5) and (6)) at 13.7 ps ((1), (3) and (5)) and 97.2 ps ((2), (4) and (6)) delay times; Scale bar, 500 nm. Stripe-like contrast represents the spin-wave wavefronts. Reprinted with permission[129]. Copyright 2025, Springer Nature.


