


fig3
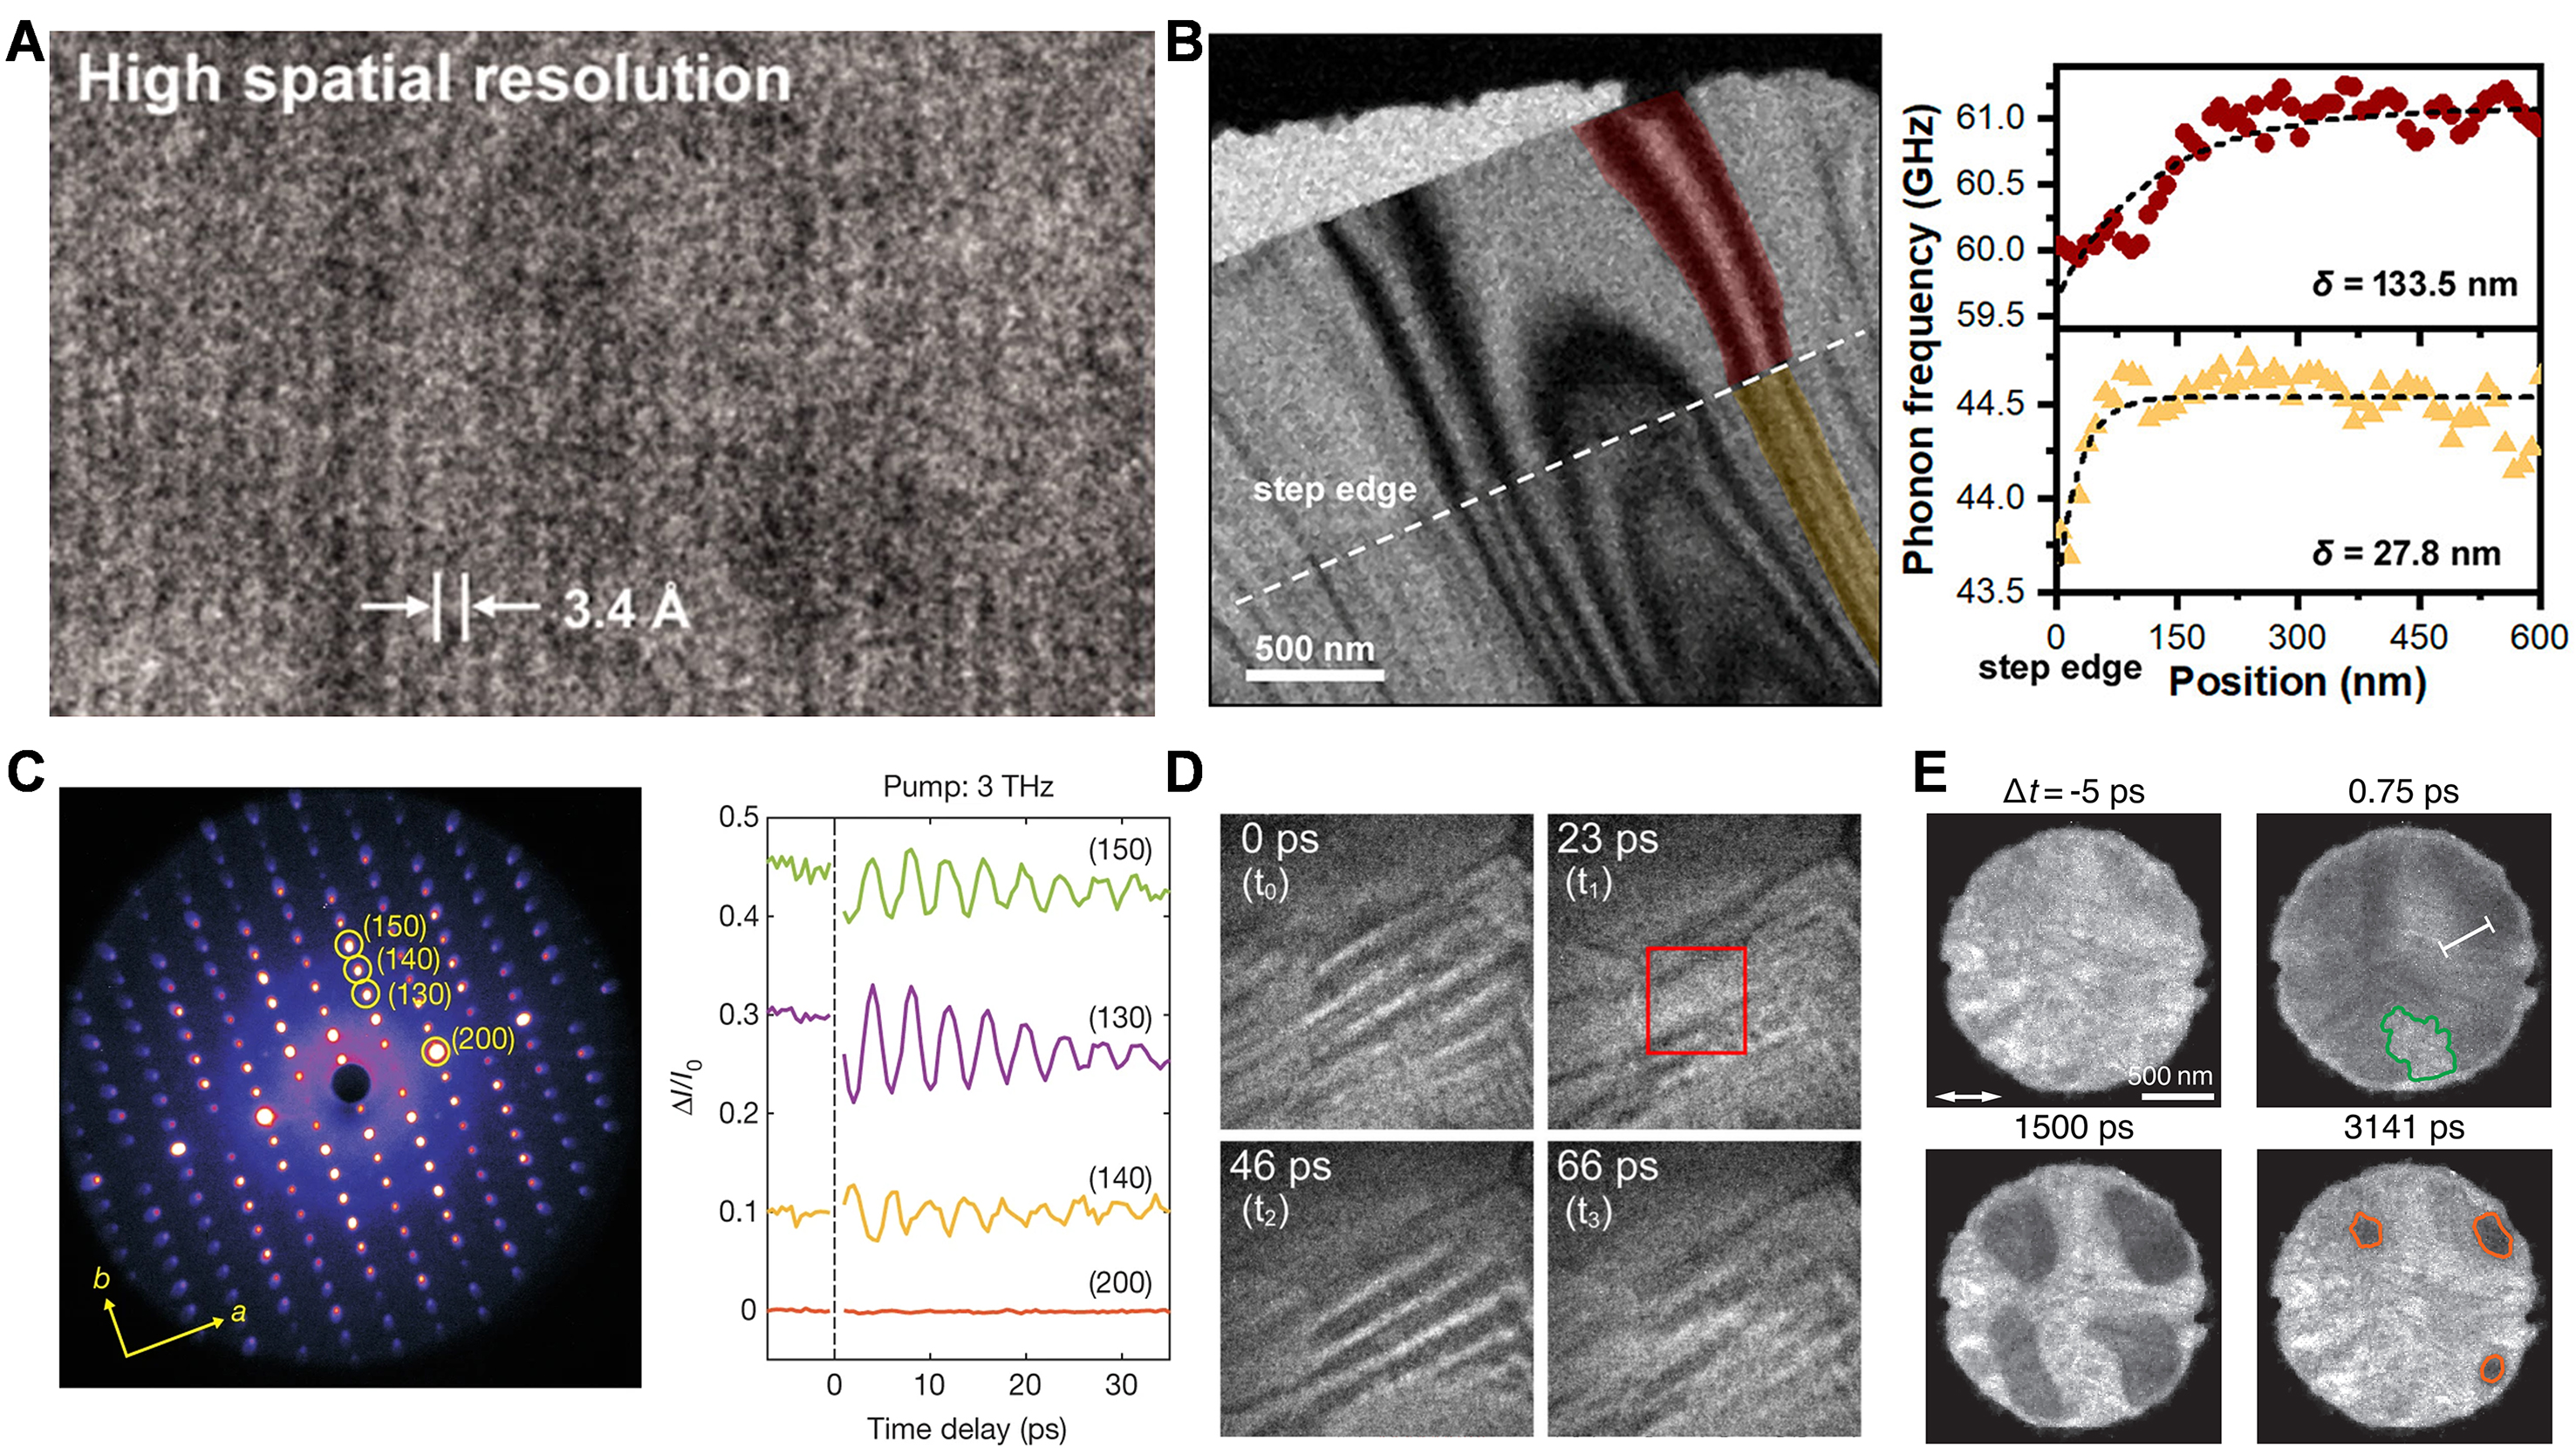
Figure 3. (A) High-resolution UTEM image of graphite with lattice-plane spacing of 3.4 Å. Reprinted with permission[48]. Copyright 2010, AAAS. (B) Representative UTEM image of a freestanding 2H-MoS2 flake with highlighted regions of interest (ROIs) from which phonon dynamics were mapped, and position-dependent phonon frequency in each ROI. Reprinted with permission[52]. Copyright 2021, American Chemical Society. (C) Measured diffraction pattern of WTe2 at equilibrium and changes in Bragg peak intensity as a function of time delay between terahertz pump pulses and the electron beam. Reprinted with permission[67]. Copyright 2019, Springer Nature. (D) Laser-induced martensitic transition and nucleation in the shape memory alloy MnNiSn detected by bright-field imaging. Reprinted with permission[81]. Copyright 2017, American Physical Society. (E) Laser-induced charge-density wave phase transition in 1T-TaS2 captured by dark-field imaging. Reprinted with permission[56]. Copyright 2021, AAAS.


