


fig20
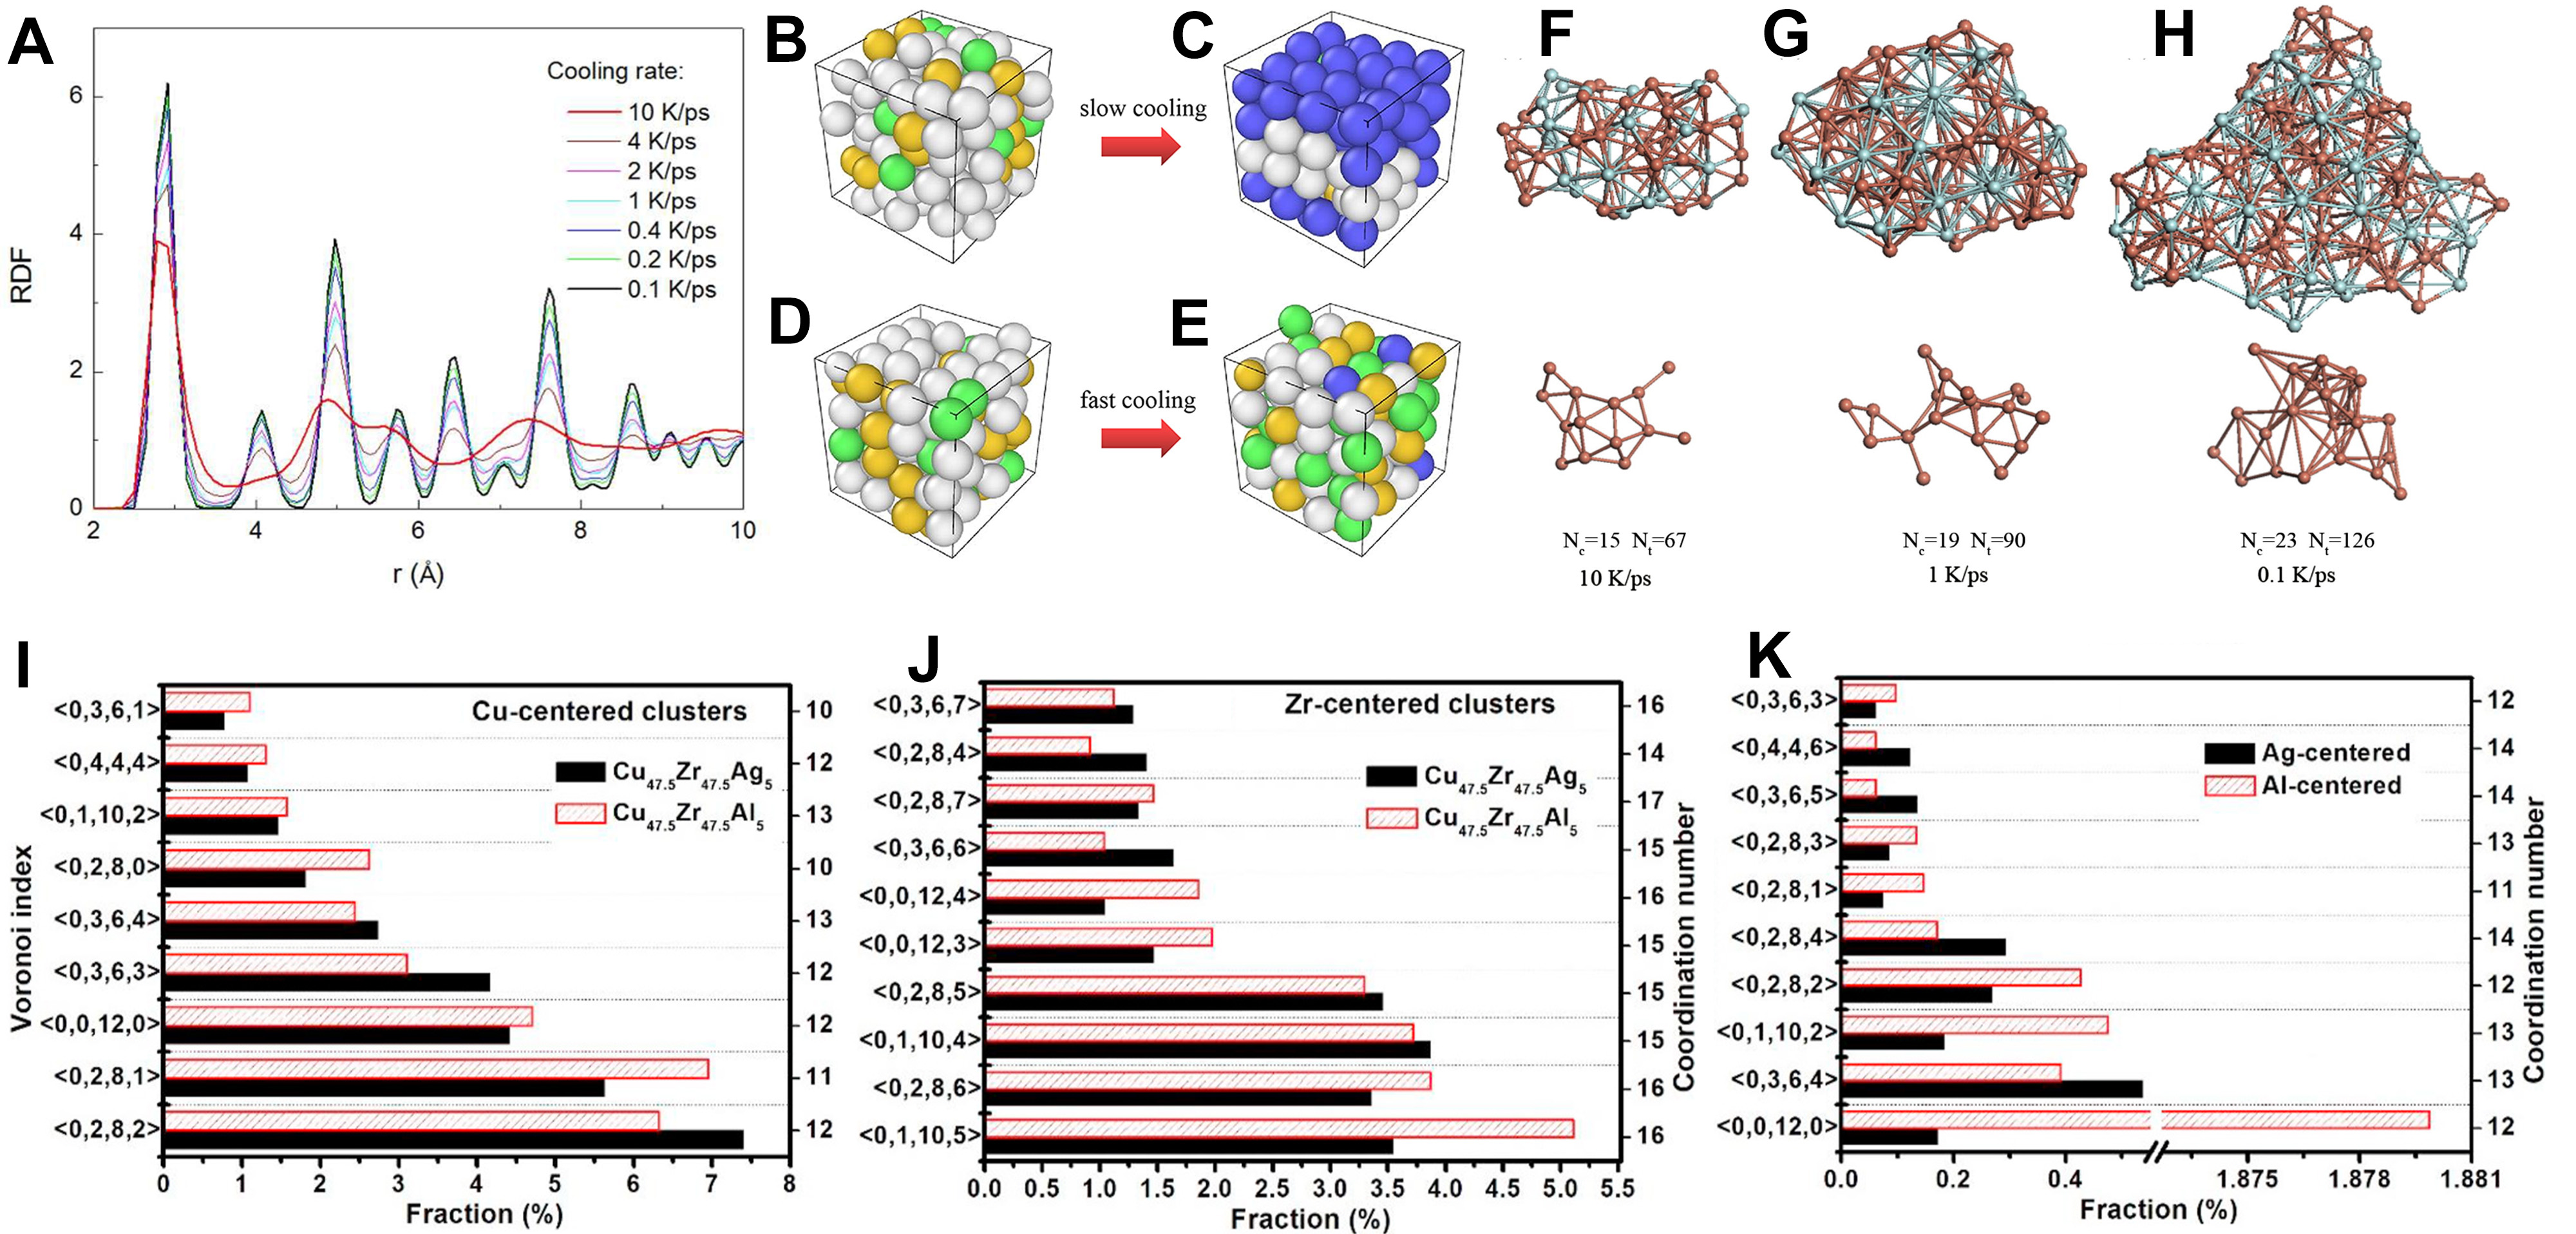
Figure 20. (A) PDF of the solidification structures at 273 K under different cooling rates; Reprinted with permission[160]. Copyright 2016, Royal Society of Chemistry; Simulation snapshots of the melt (B and C) and solid (D and E) under two cooling rates: the upper layer is slow cooling, and the lower layer is fast cooling, where the white balls represent atoms of other structures, the green balls represent FCC-like atoms, yellow balls represent icosahedral (ICOS)-like atoms, and the blue balls represent BCC-like atoms. The spatial distribution of icosahedral MRO superclusters and their central atoms in the Cu64Zr36 metallic glass at 300 K under various cooling rates; Panels B, C, D and E are quoted with permission from Ref.[164]. Copyright 2021, Elsevier; (F) 10 K/ps, (G) 1 K/ps, and (H) 0.1 K/ps. The orange and blue balls denote the Cu and Zr atoms, respectively. Panels F, G and H are quoted with permission from Ref.[165]. Copyright 2018, Elsevier; Fraction of the most dominant VPs of (I) Cu- and (J) Zr-centered for both MGs; (K) Fraction of Ag- and Al-centered clusters. PDF: Pair distribution function; FCC: face-centered cubic; BCC: body-centered cubic; Panels I, J and K are quoted with permission from Ref.[169]. Copyright 2021, Elsevier. VPs: Voronoi polyhedrons.


