


fig19
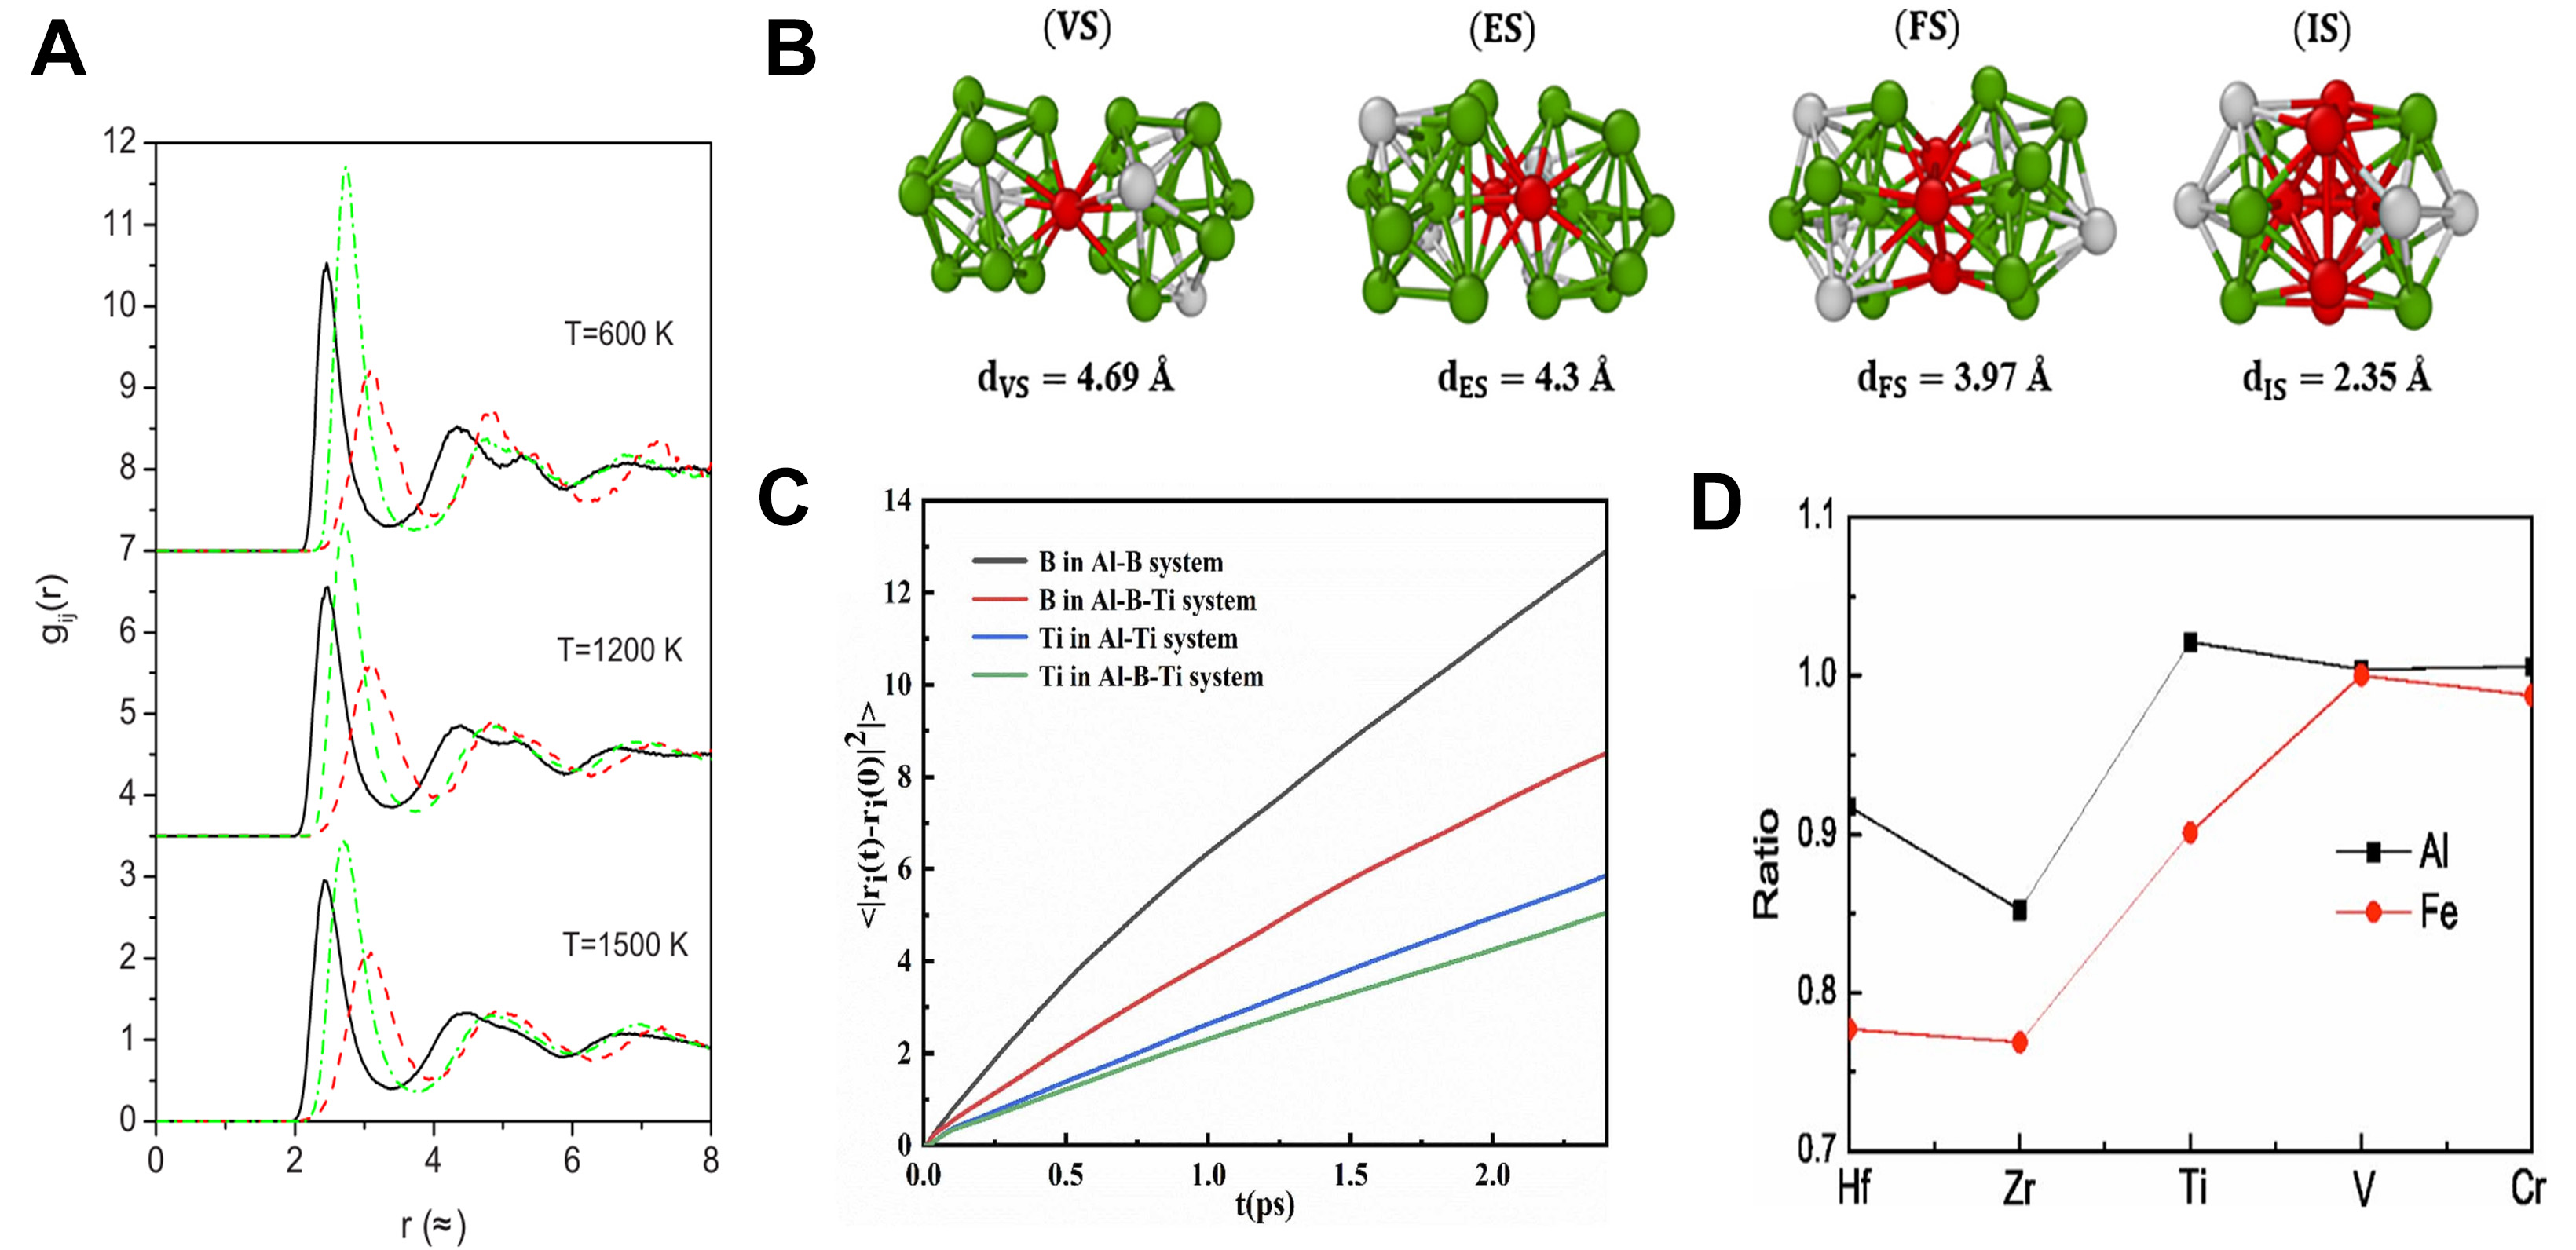
Figure 19. (A) Partial pair-correlation functions, gCu-Cu(r) solid lines, gCu-Zr(r) dashed lines, and gZr-Zr(r) dotted lines of liquid T = 1,500 K, undercooled T = 1,200 K, and amorphous T = 600 K Cu64Zr36 alloys. The curves for T = 1,200 and 600 K are shifted upward by an amount of 3.5 and 7, respectively; Reprinted with permission[143]. Copyright 2008, AIP Publishing; (B) Schematic illustrations of vertex, edge, face, and interpenetrating sharing modes of 〈0,0,12,0〉Voronoi polyhedra in the Ni3Al alloy. The average distance between the central atoms of two connected polyhedrons is shown. Grey and green represent Al and Ni atoms, respectively, while red balls indicate atoms shared by both polyhedral; Reprinted with permission[147]. Copyright 2017, Elsevier; (C) Mean square displacement curves of B and Ti atoms in Al-B, Al-Ti, and Al-B-Ti systems; Reprinted with permission[149]. Copyright 2024, Elsevier; (D) Ratios of DAl and DFe in Al70Fe20EM10 melts compared to those in the Al70Fe30 melt. Reprinted with permission[153]. Copyright 2007, AIP Publishing.


