


fig18
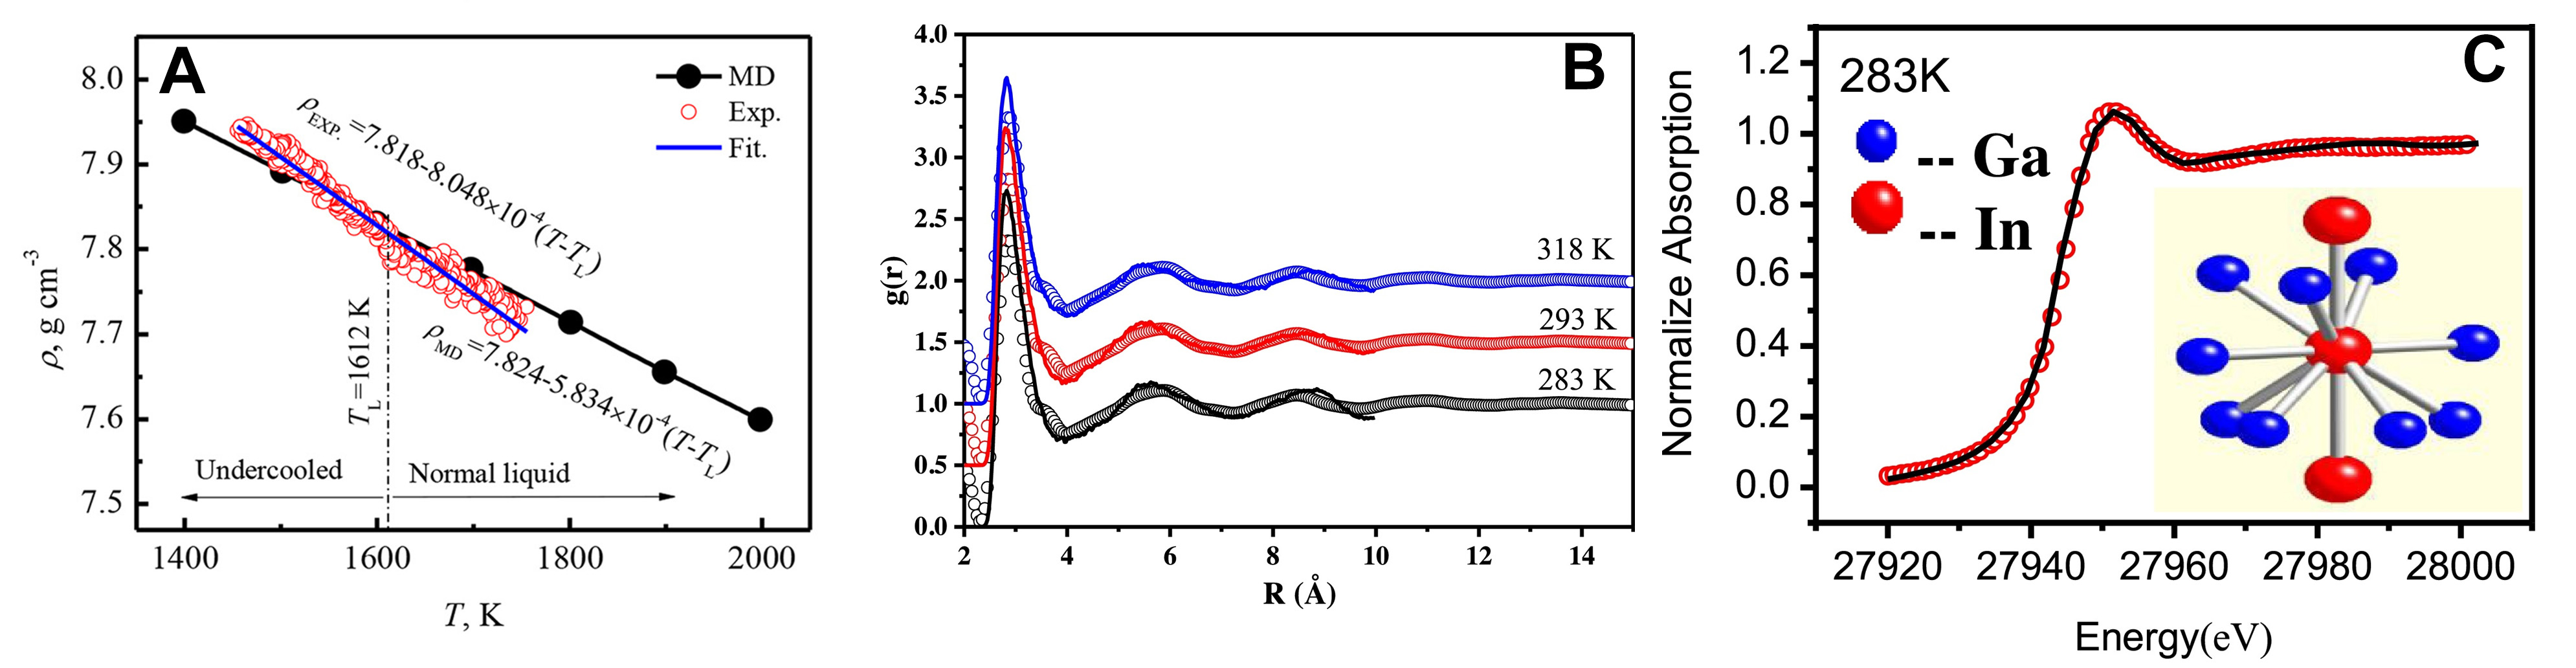
Figure 18. (A) Density of liquid Ni5Zr peritectic alloy; Reprinted with permission[138]. Copyright 2018, AIP Publishing; (B) The pair distribution function g(r) of the Ga90In10 alloy melt under different temperatures. The solid curves are the simulated results and the curves with empty dots are the XRD experiment results; (C) Comparison between the experiments and simulations on X-ray Absorption Near Edge Structure (XANES) spectra at the K-edge of In for the normal and undercooled liquid Ga90In10 alloy. The curves with empty red dots are the experimental XANES spectra and the black curves are the simulated spectra based on the multiple-scattering theory. The inset figures show the models of the clusters, which contain one center In atom and other atoms on the first shell in the Ga90In10 alloy melt at the corresponding temperature. Panels B and C are quoted with permission from Ref.[139]. Copyright 2021, Elsevier. XRD: X-ray diffraction; MD: molecular dynamics.


