


fig14
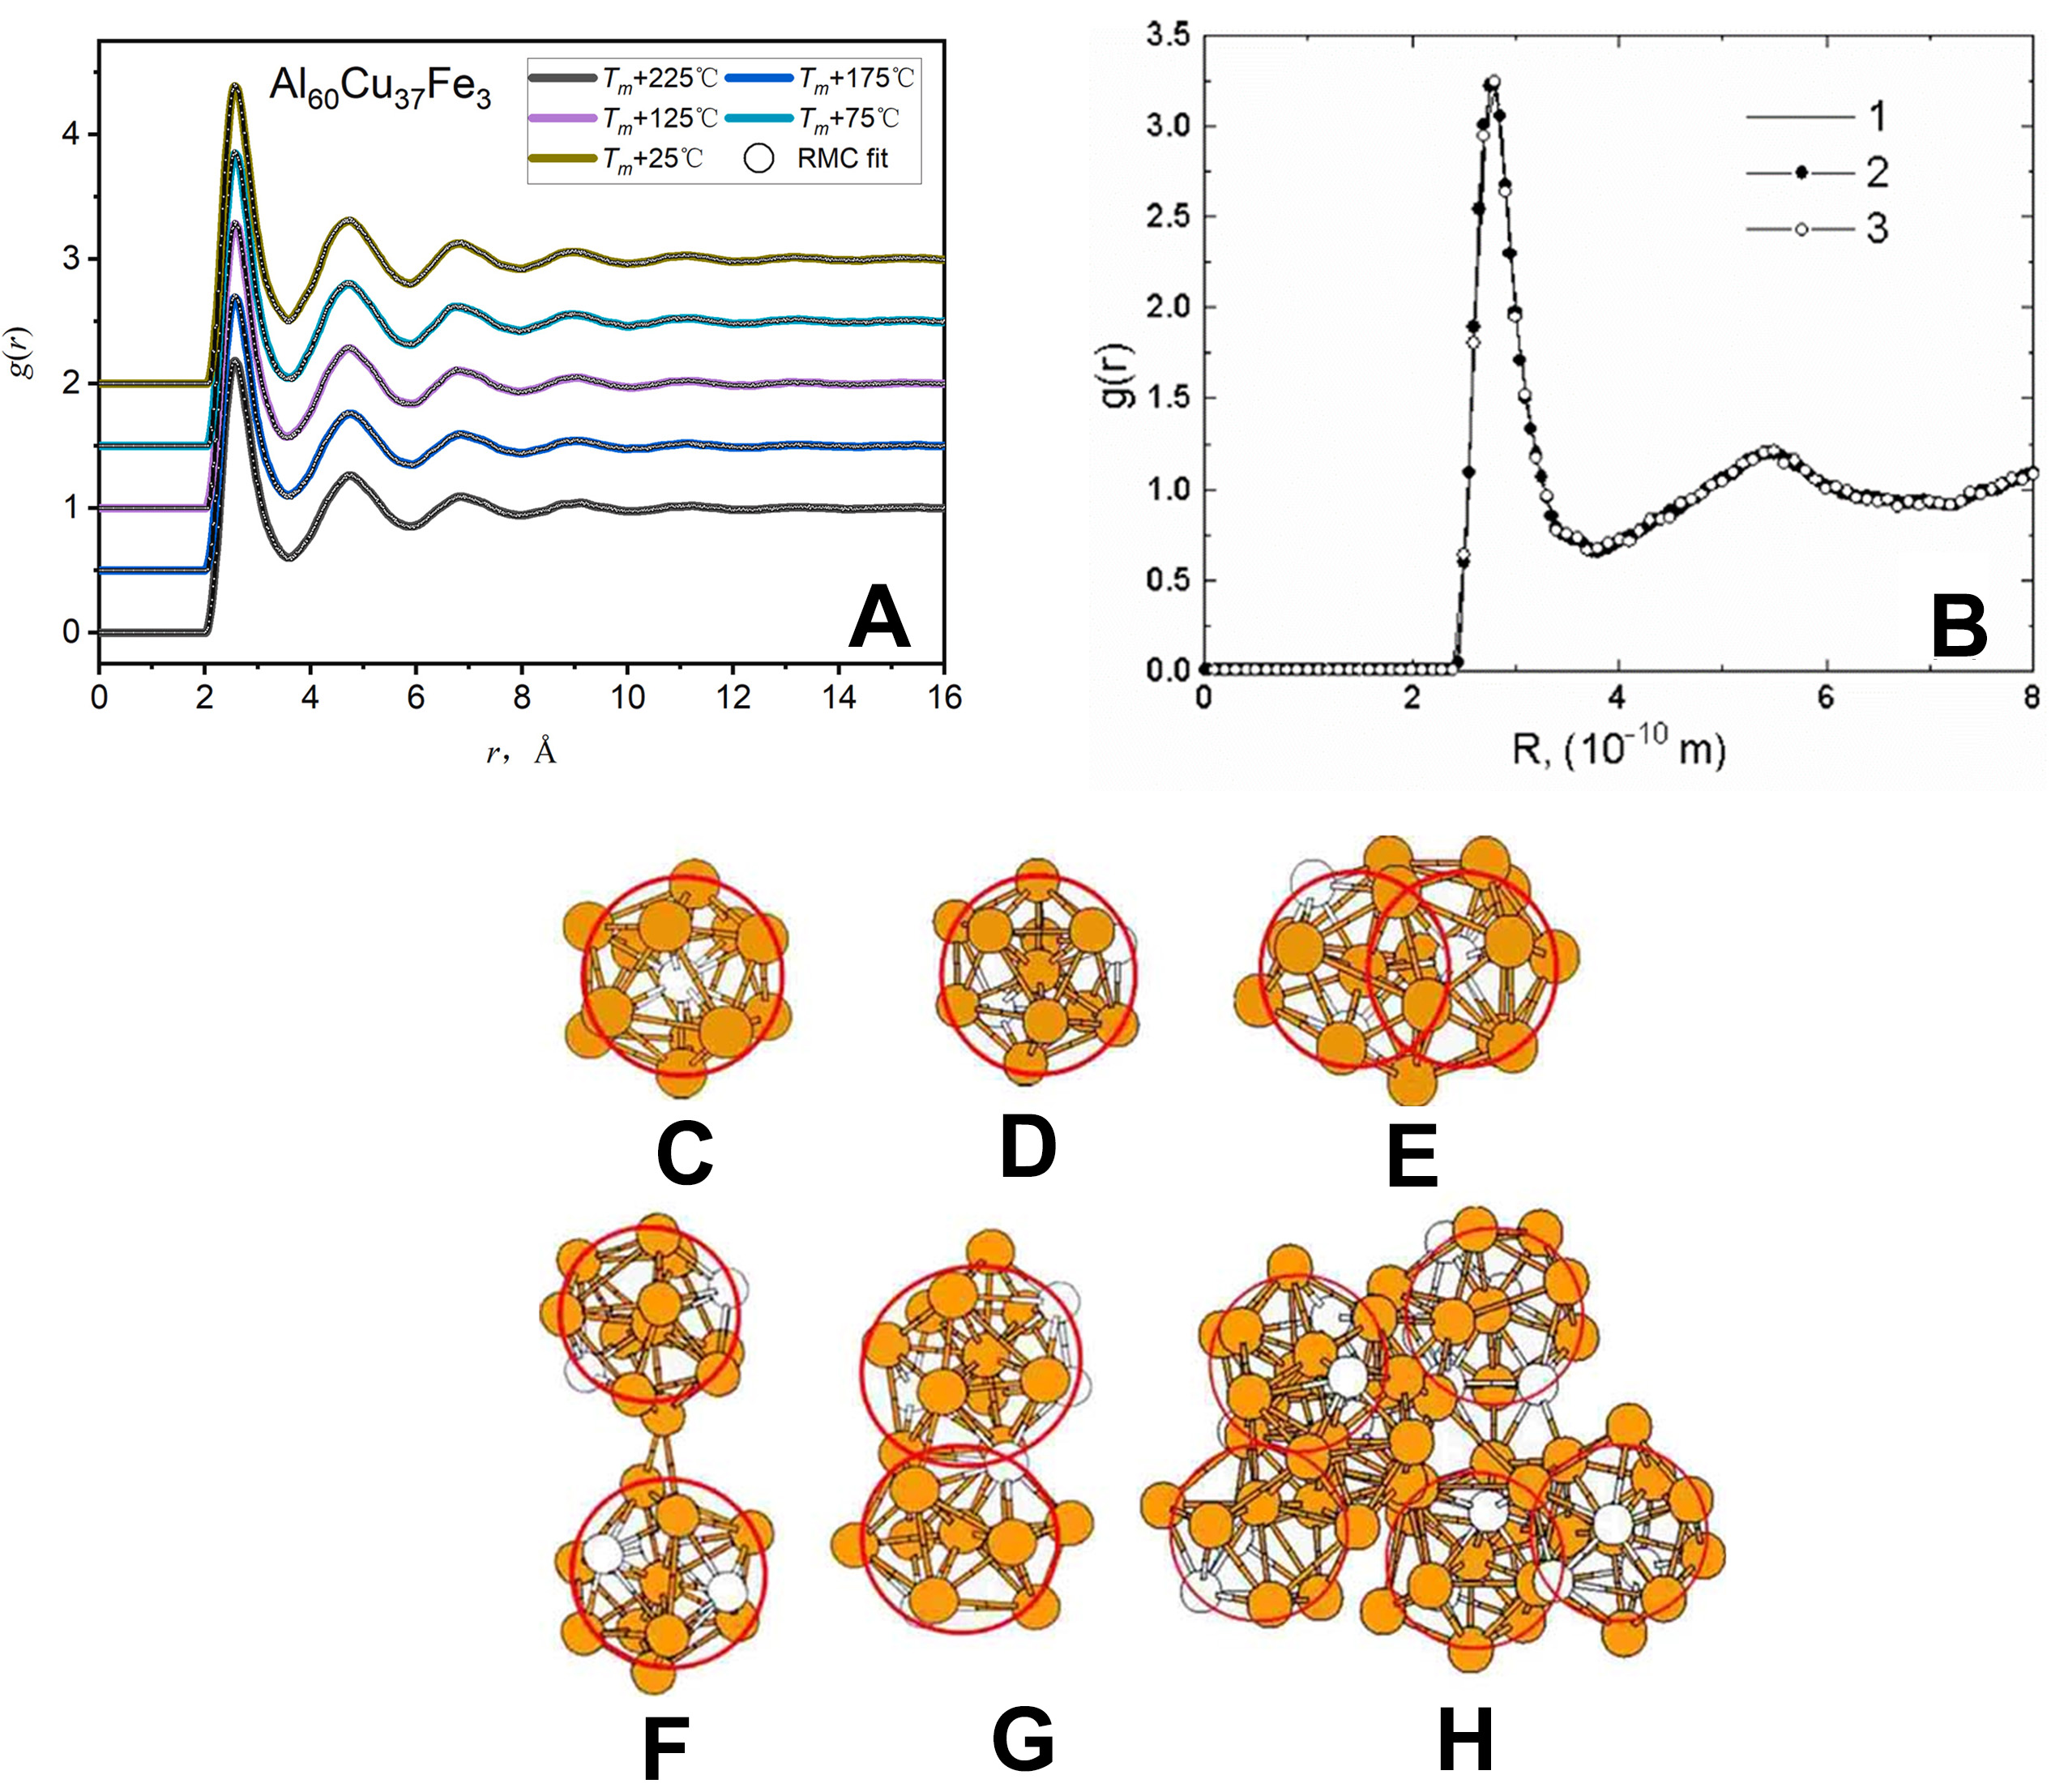
Figure 14. (A) Pair correlation function, g(r), of quasicrystal-forming Al60Cu37Fe3 liquid obtained from the experiment at different temperatures (solid lines) and the corresponding RMC fit (open black circles); Reprinted with permission[93]. Copyright 2021, Elsevier; (B) A comparison of the pair correlation functions of liquid gallium at 293 K: (1) the diffraction experiment (target), (2) the RMC model, and (3) the MD model, Icosahedral clusters of metallic glass alloy ZrPt from MD simulation, Reprinted with permission[95]. Copyright 2002, Elsevier; (C) Pt-centered, (D) Zr-centered, (E) interpenetrating icosahedra, (F) vertex-connected, (G) Face-sharing icosahedra, and (H) MRO made up of icosahedra in glass Zr73Pt27. Yellow and white spheres denote Zr and Pt atoms, respectively. Panels C, D, E, F, G and H are quoted with permission from Ref.[98]. Copyright 2008, American Physical Society. RMC: Reverse Monte Carlo; MD: molecular dynamics; MRO: medium-range order.


