


fig10
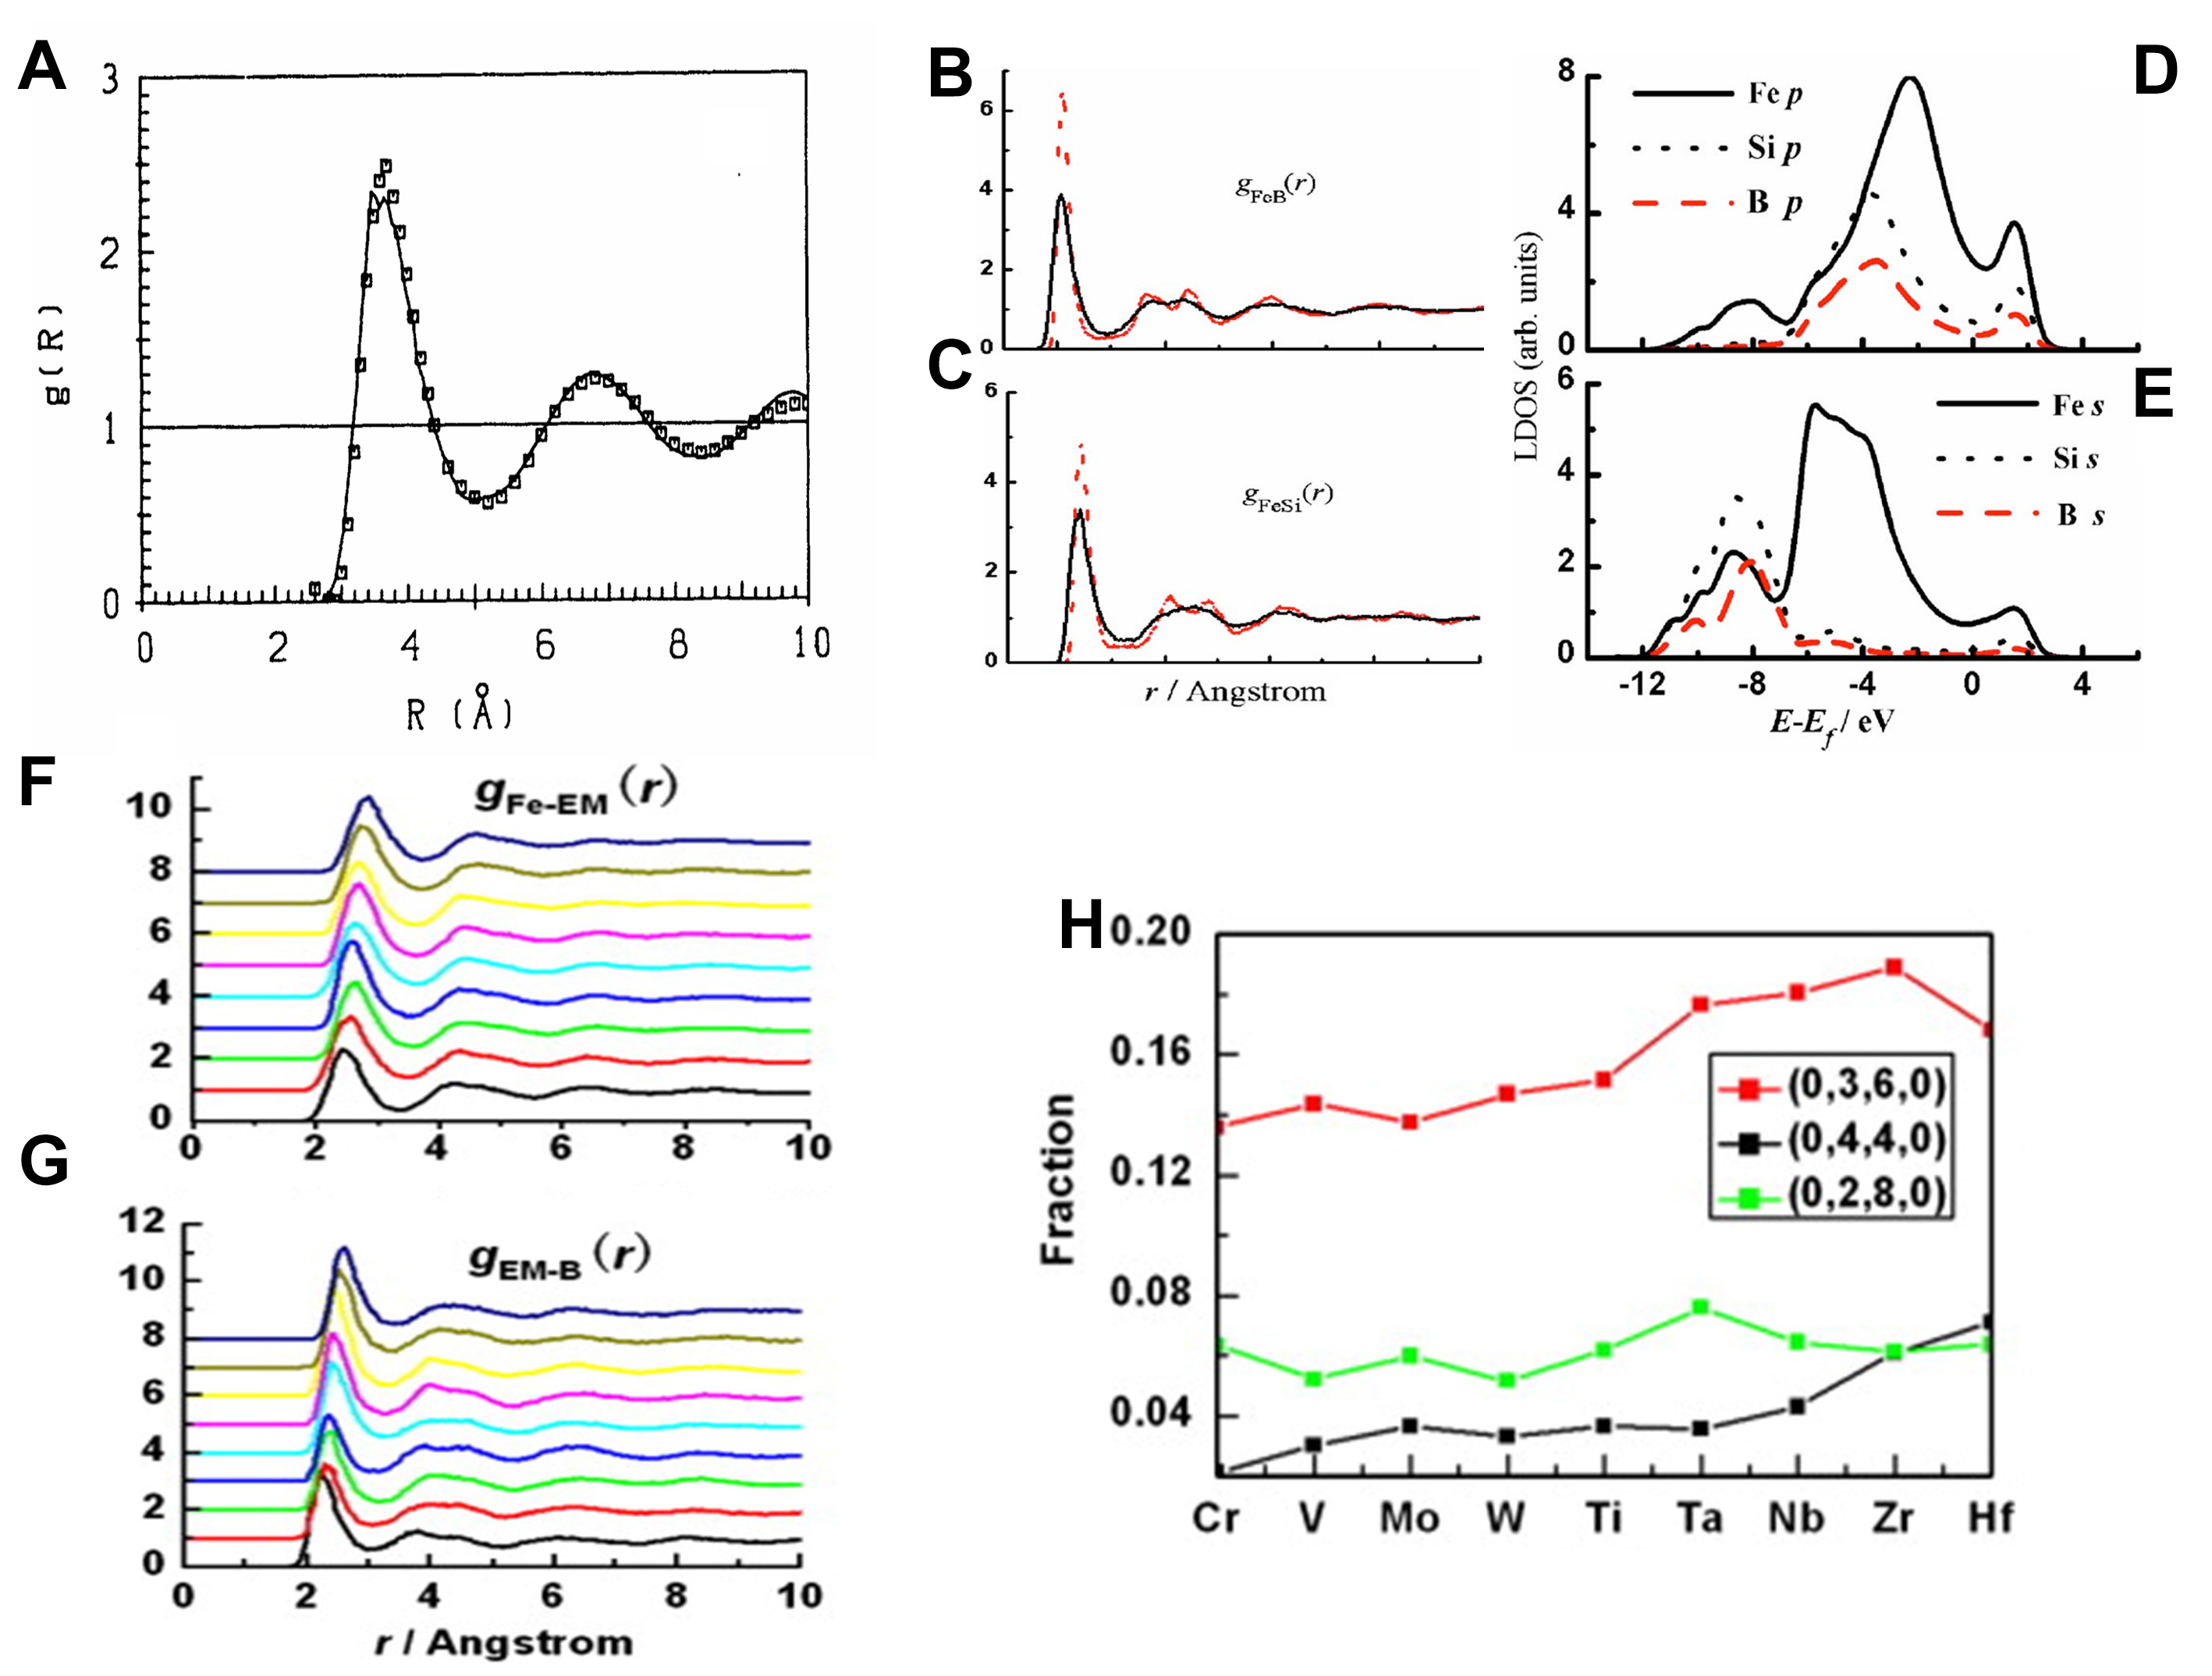
Figure 10. (A) Pair correlation function for liquid Na at T = 400 K; full curve AIMD, squares-experiment, Reprinted with permission[65]. Copyright 2012, Elsevier; (B) and (C) PDFs of both the liquid and amorphous Fe78Si9B13 alloys. The red dash is for the amorphous state and the black line for the liquid state, Panels B and C are quoted with permission from Ref.[71]. Copyright 2007, AIP Publishing; (D) and (E) local densities of states of the Fe, Si, and B atoms of the amorphous alloy, Panels D and E are quoted with permission from Ref.[71]. Copyright 2007, AIP Publishing; (F) and (G) F-Z pair correlation functions of liquid Fe70EM10B20 alloys. The curves from the bottom to the top in each panel belong to Fe70Cr10B20, Fe70V10B20, Fe70Mo10B20, Fe70W10B20, Fe70Ti10B20, Fe70Ta10B20, Fe70Nb10B20, Fe70Zr10B20 and Fe70Hf10B20, (H) Fractions of top three Kasper Voronoi polyhedra around B atoms Panels D and E are quoted with permission from Ref.[73]. Copyright 2010, Elsevier. AIMD: Ab initio molecular dynamics; PDF: pair distribution function.


