


fig7
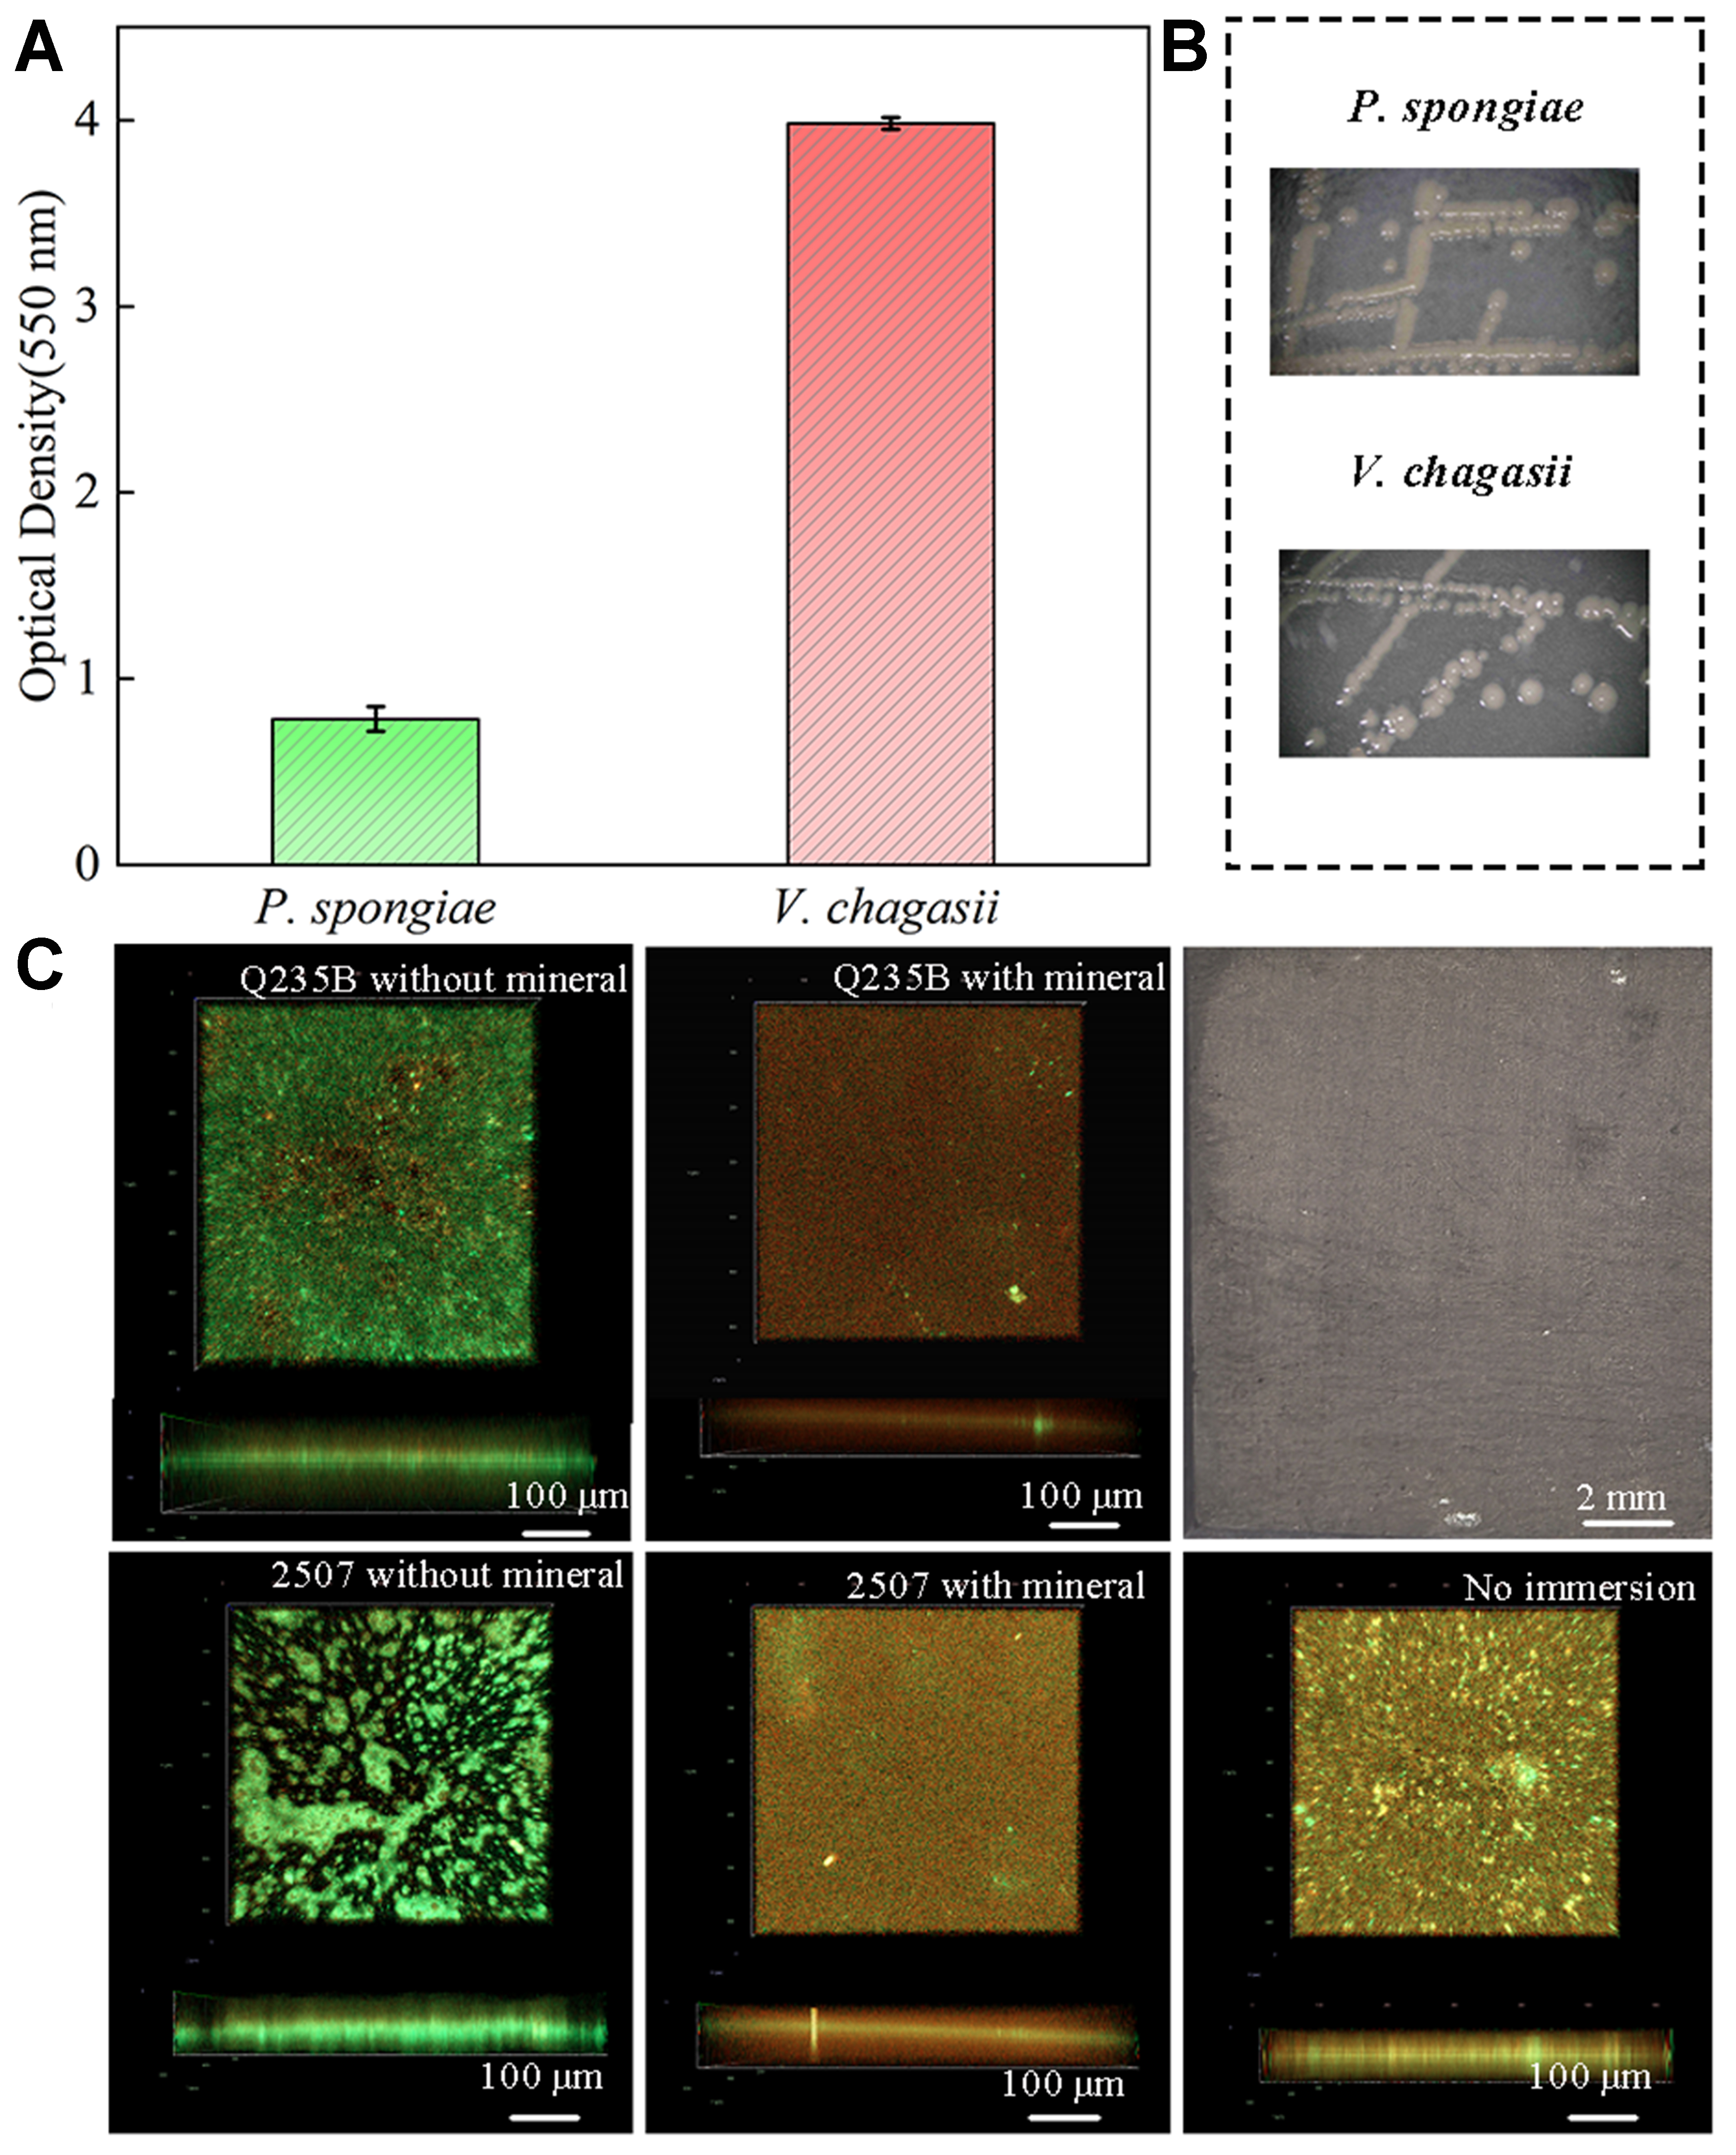
Figure 7. (A and B) The adhesive capacity and morphology of P. spongiae and V. chagasii. Error bars represent standard deviation (SD); (C) The biofilm of V. chagasii on Q235B, 2507 without and with biomineral after 7 days immersion, the macroscopic view of the biomineralized layer is in the upper right corner.


