


fig5
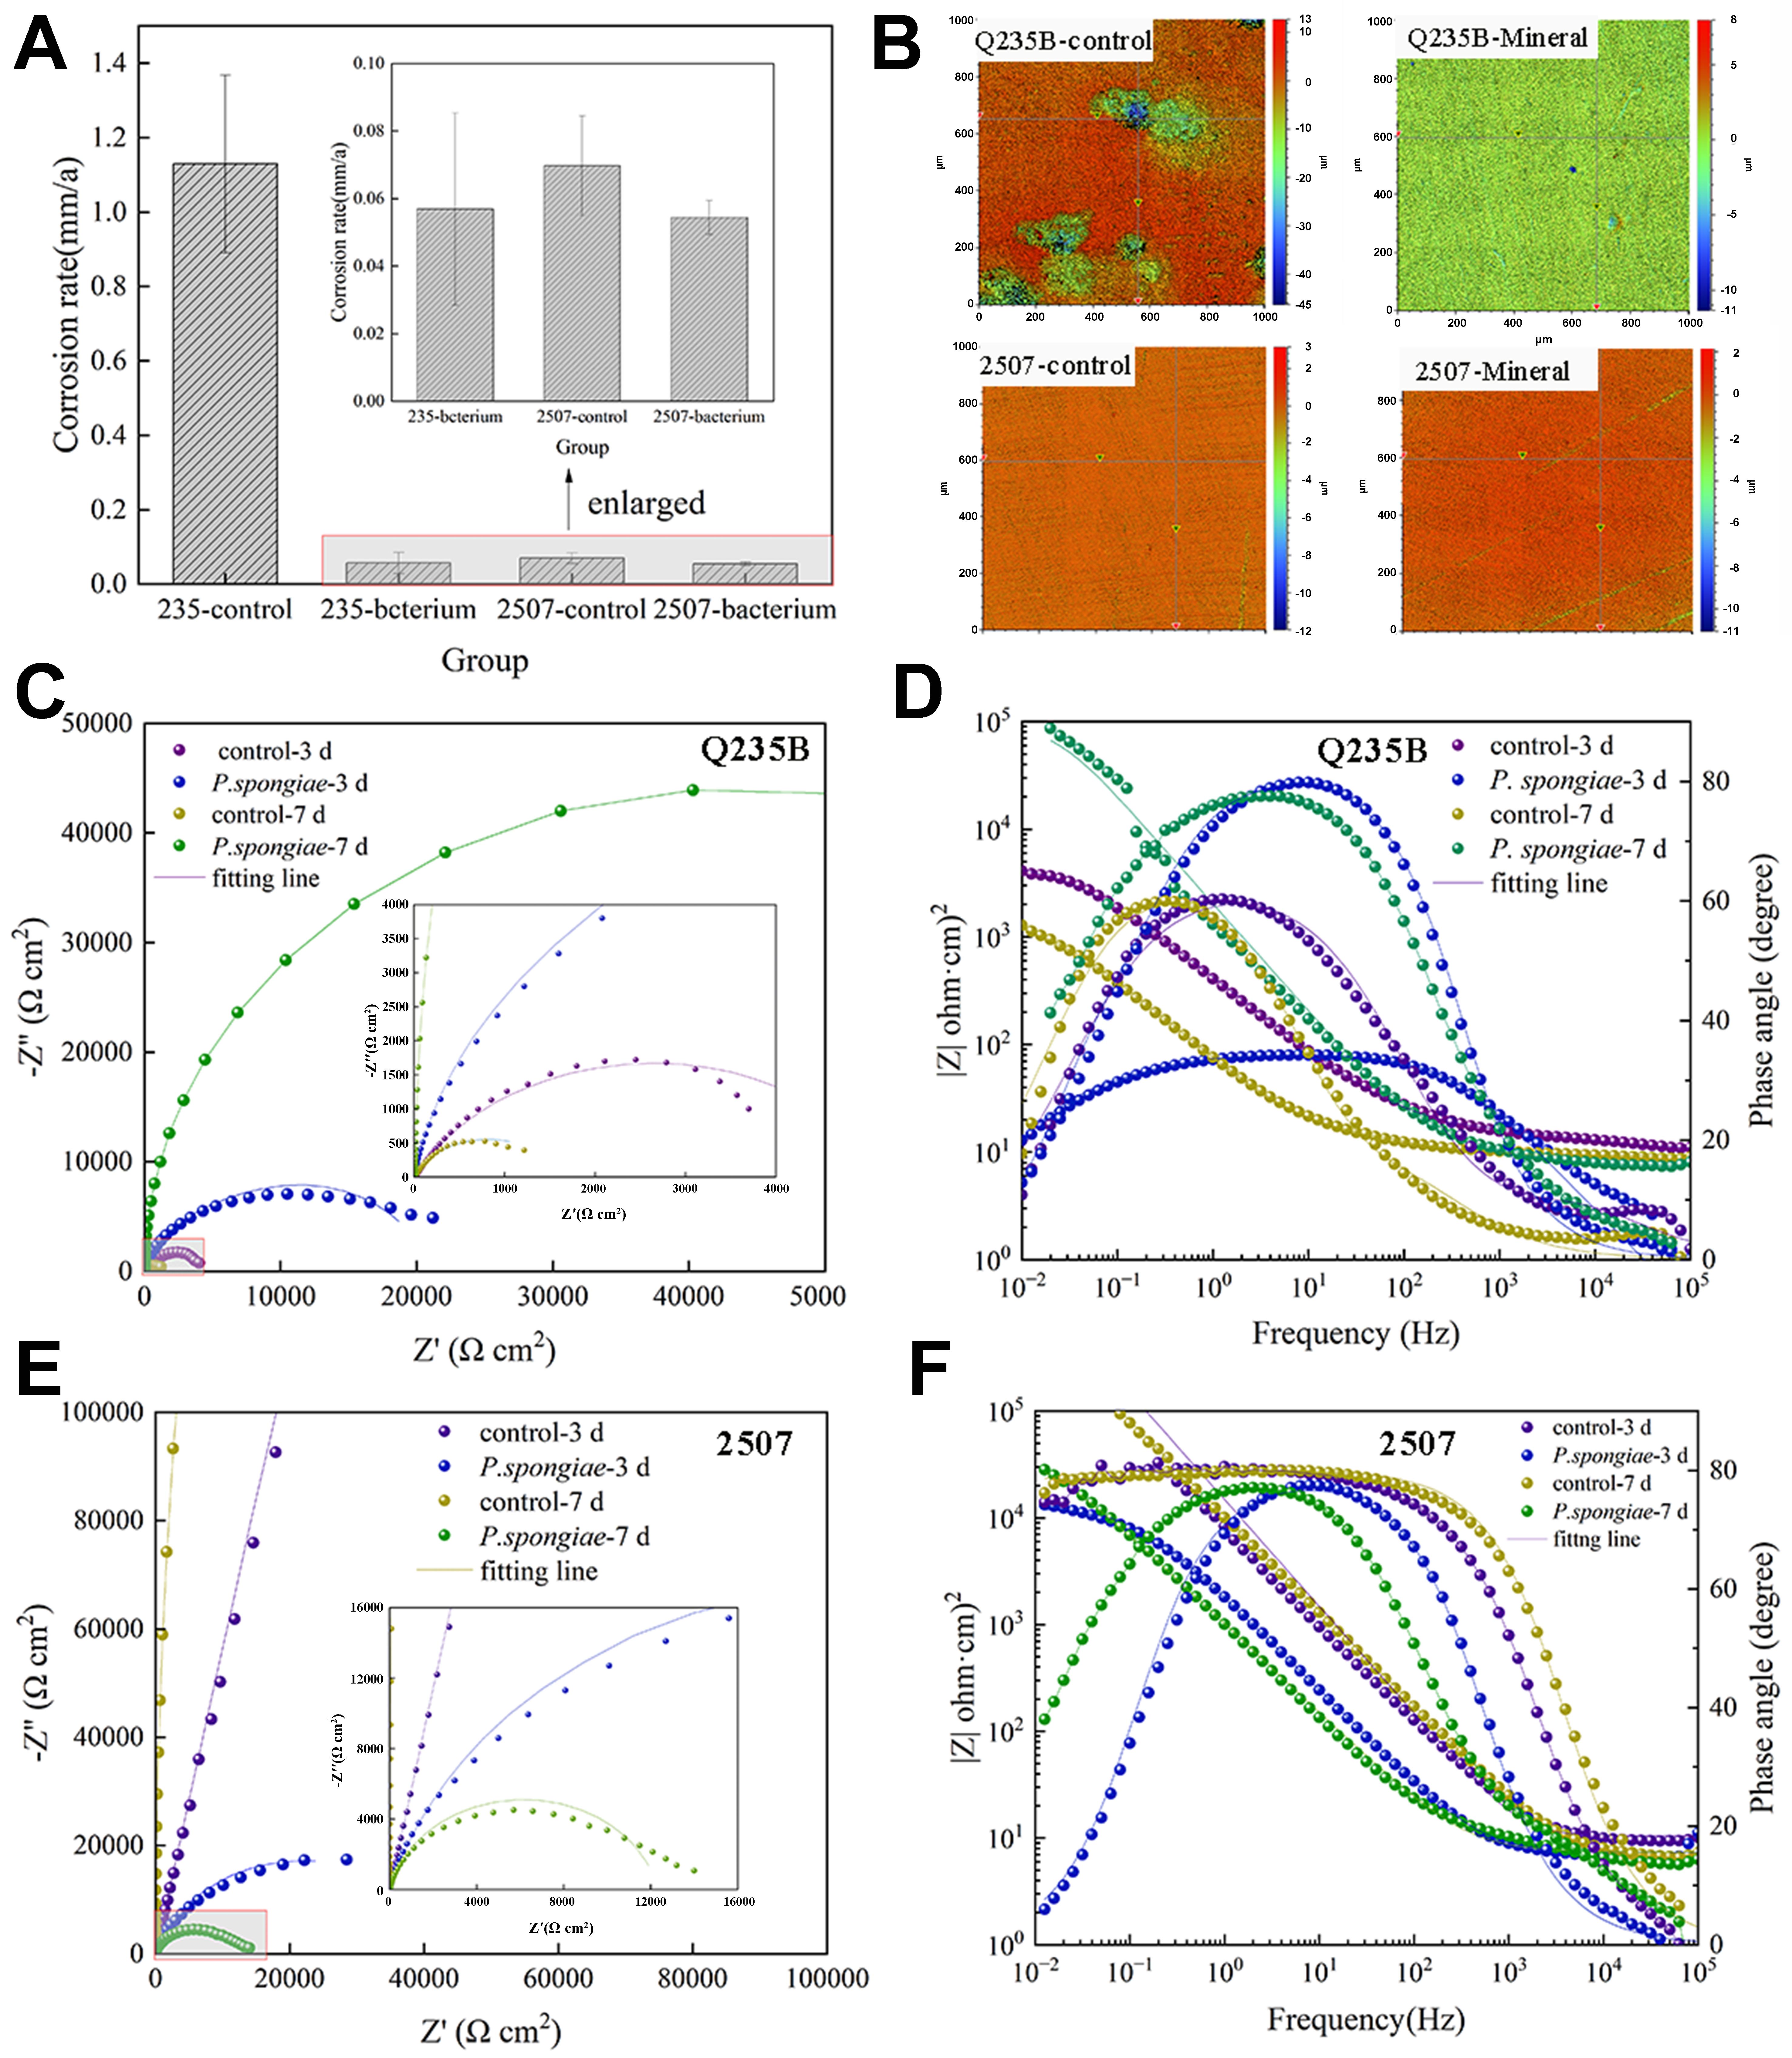
Figure 5. (A) The uniform corrosion rate of 235 and 2507 steels. Error bars represent standard deviation (SD); (B) Heat map of the localized corrosion of Q235B and 2507 after 7 days immersion; (C) Nyquist plot and (D) Bode plot of Q235B immersed in bacterial suspension for 7 days; (E) Nyquist plot and (F) Bode plot of 2507 immersed in bacterial suspension during 7 days (error bars represent the variance of the three repeating groups. The statistical significance is *P < 0.05, **P < 0.01).


