


fig3
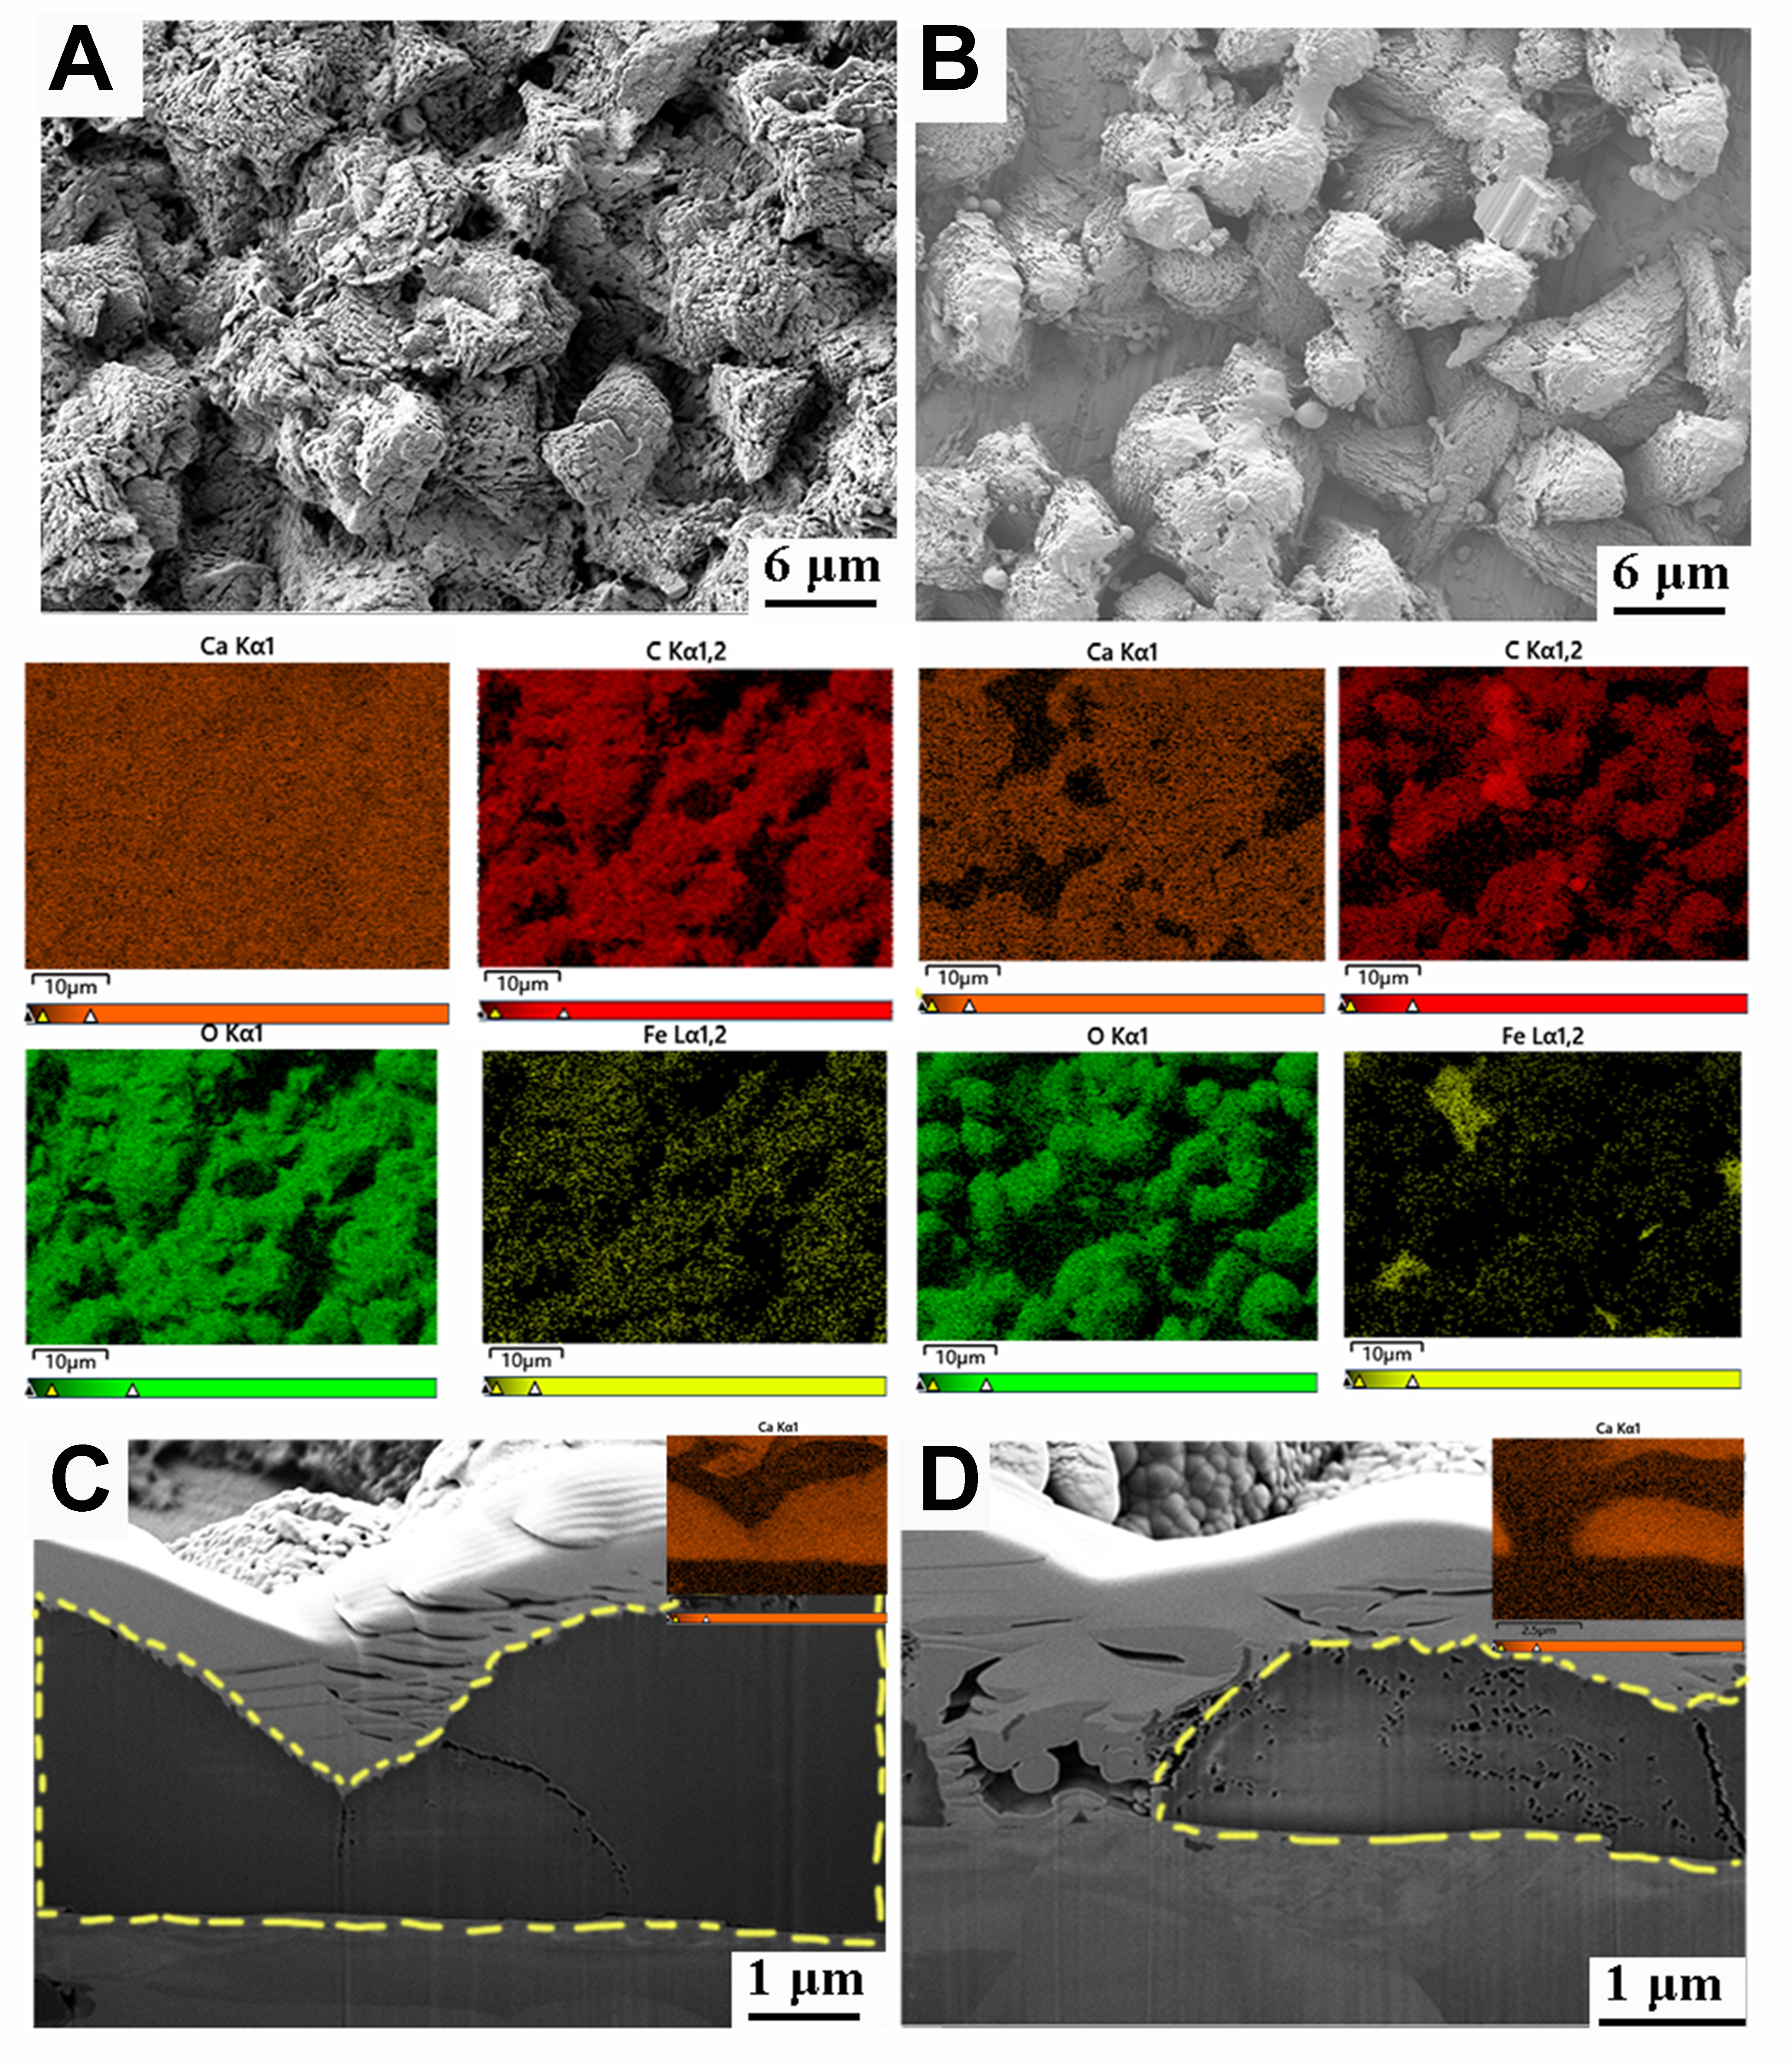
Figure 3. The SEM images of (A) Q235B and (B) 2507 with corresponding EDS images immersed in bacterial solution after 7 days; The cross-sectional SEM images with calcium element distribution of (C) Q235B and (D) 2507 after immersion of 7 days. SEM: Scanning electron microscopy; EDS: energy-dispersive X-ray spectroscopy.


