


fig5
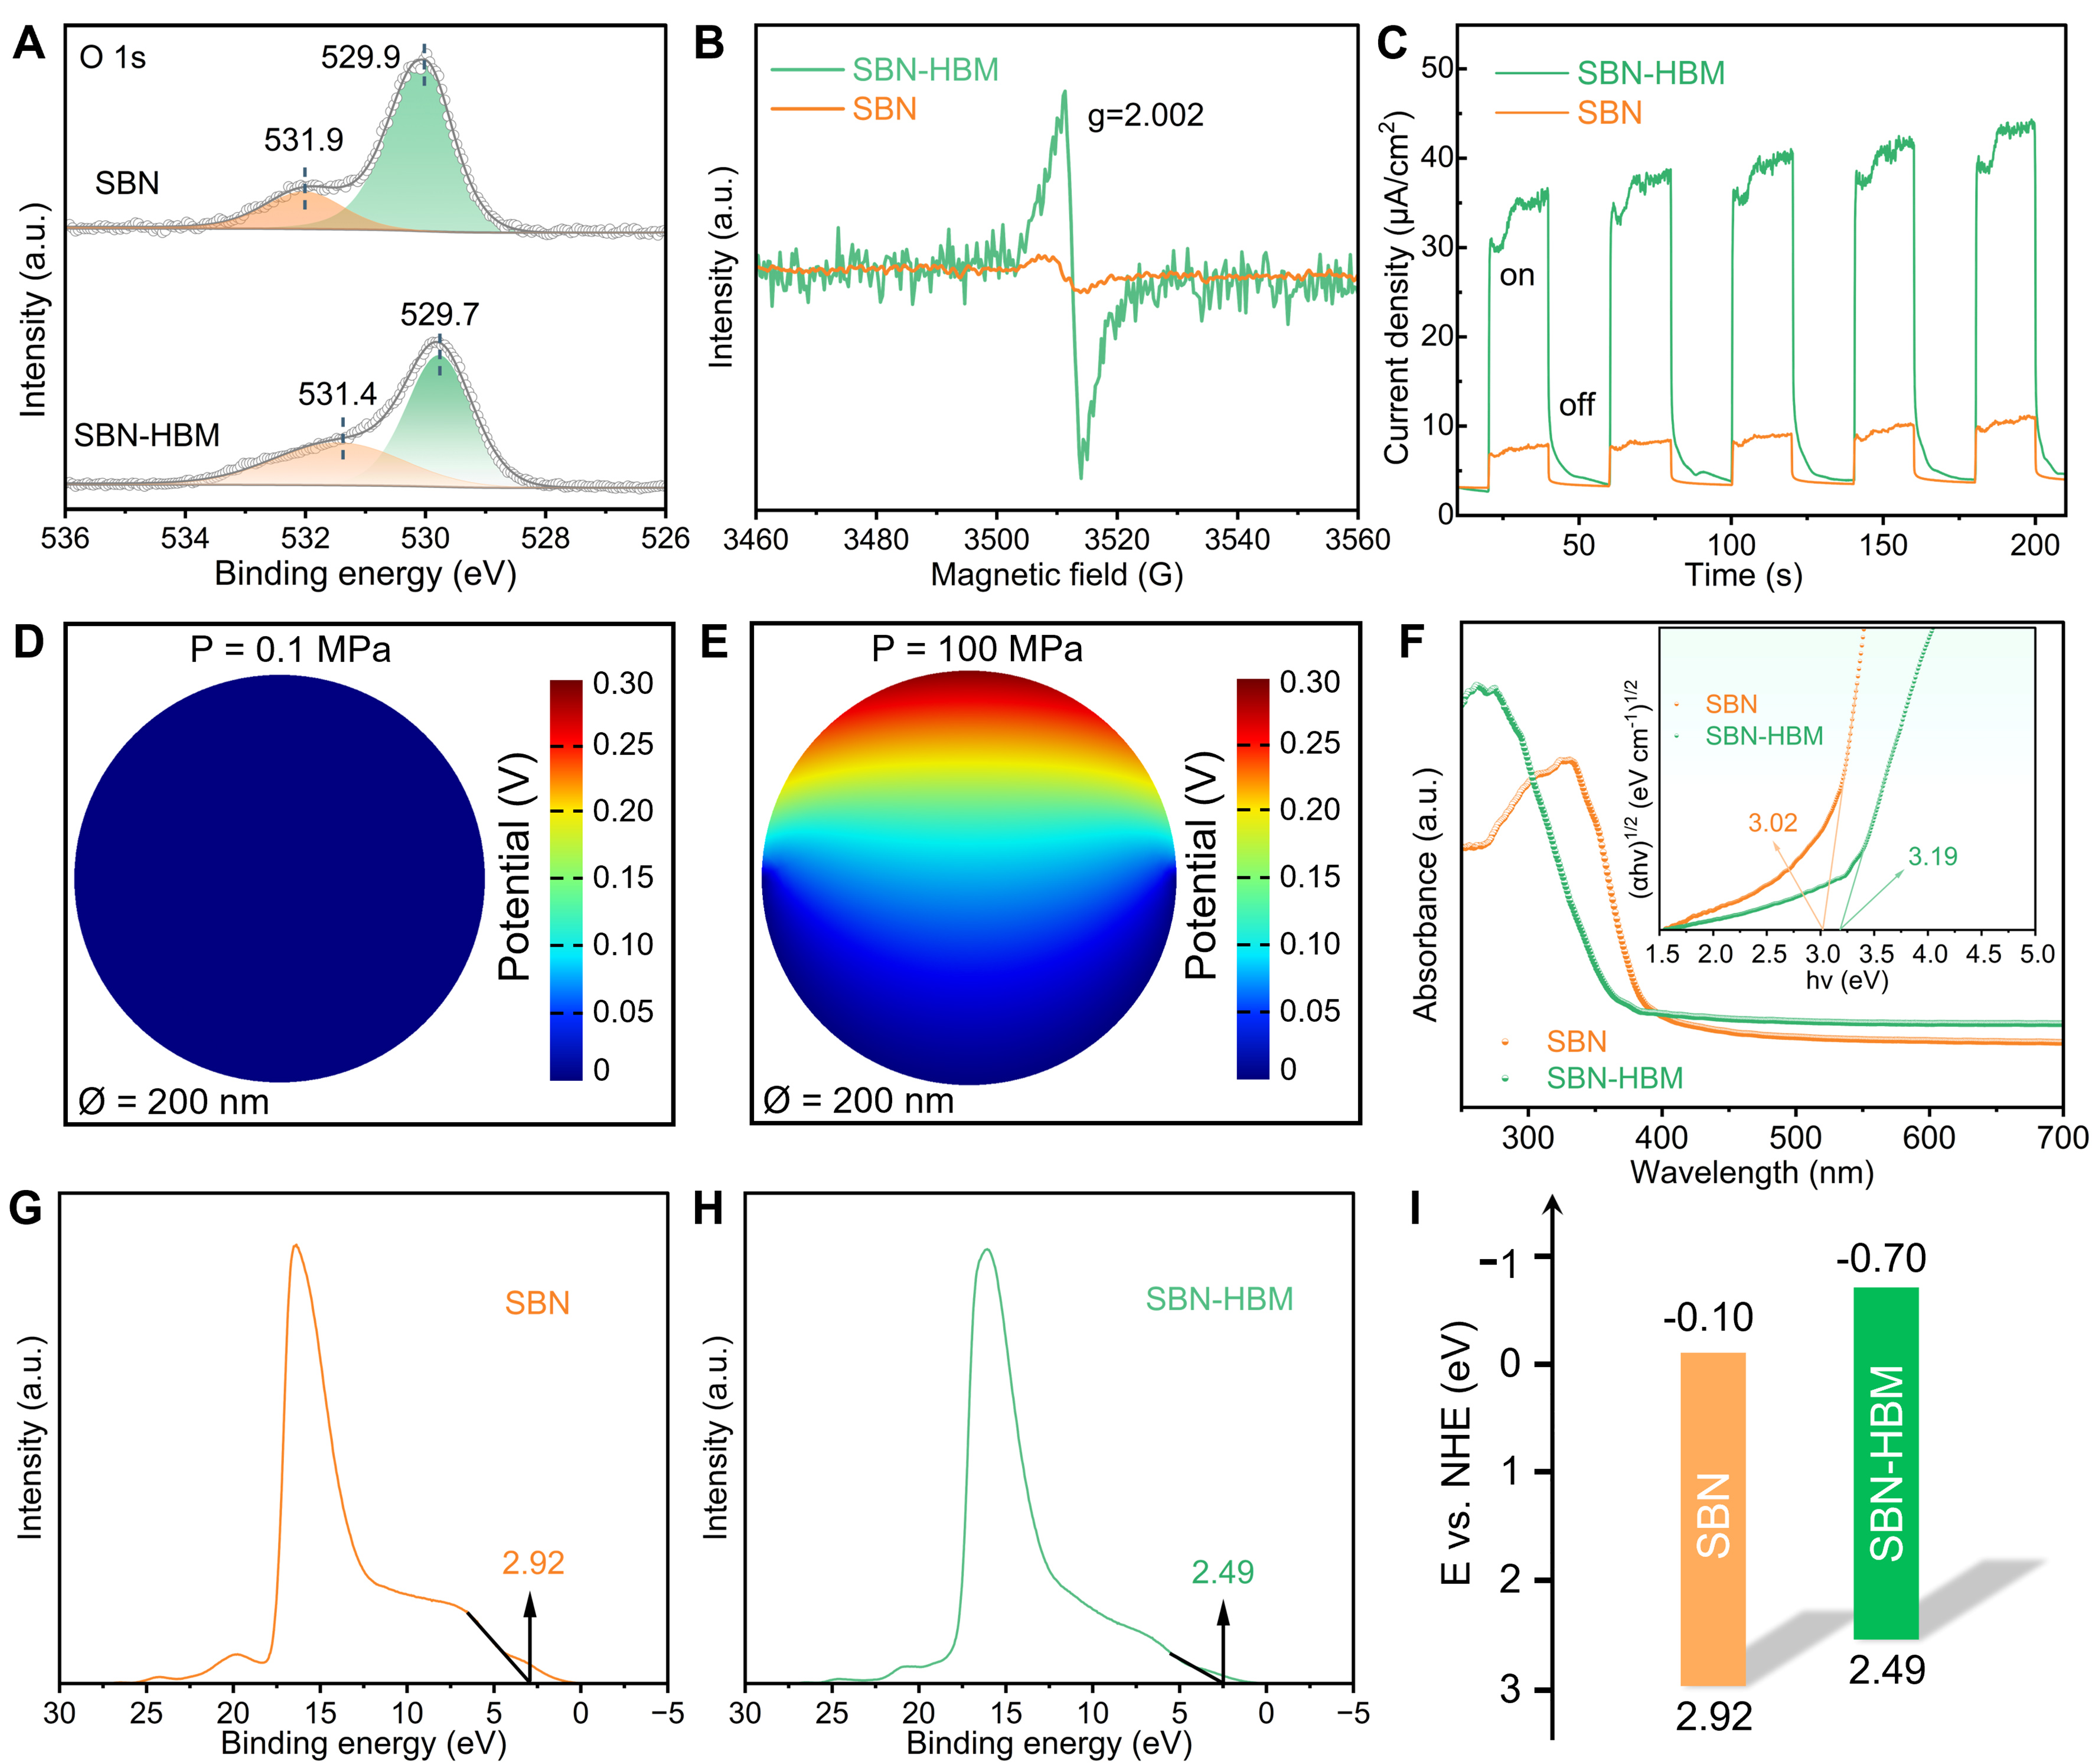
Figure 5. (A) XPS O 1s spectra, (B) EPR spectra, (C) the piezo-current responses for SBN and SBN-HBM. FEM simulation of the piezoelectric potential distribution in SBN-HBM under a cavitation pressure of (D) 0.1 and (E) 100 MPa; (F) UV-vis absorption spectra (inset: Tauc plot), and UPS spectra of (G) SBN and (H) SBN-HBM; (I) Band schematic diagram for SBN and SBN-HBM. XPS: X-ray photoelectron spectroscopy; EPR: electron paramagnetic resonance; SBN: Sr0.5Ba0.5Nb2O6; HBM: high-energy ball milling; FEM: finite-element method; UV-vis: ultraviolet-visible.


