
fig3
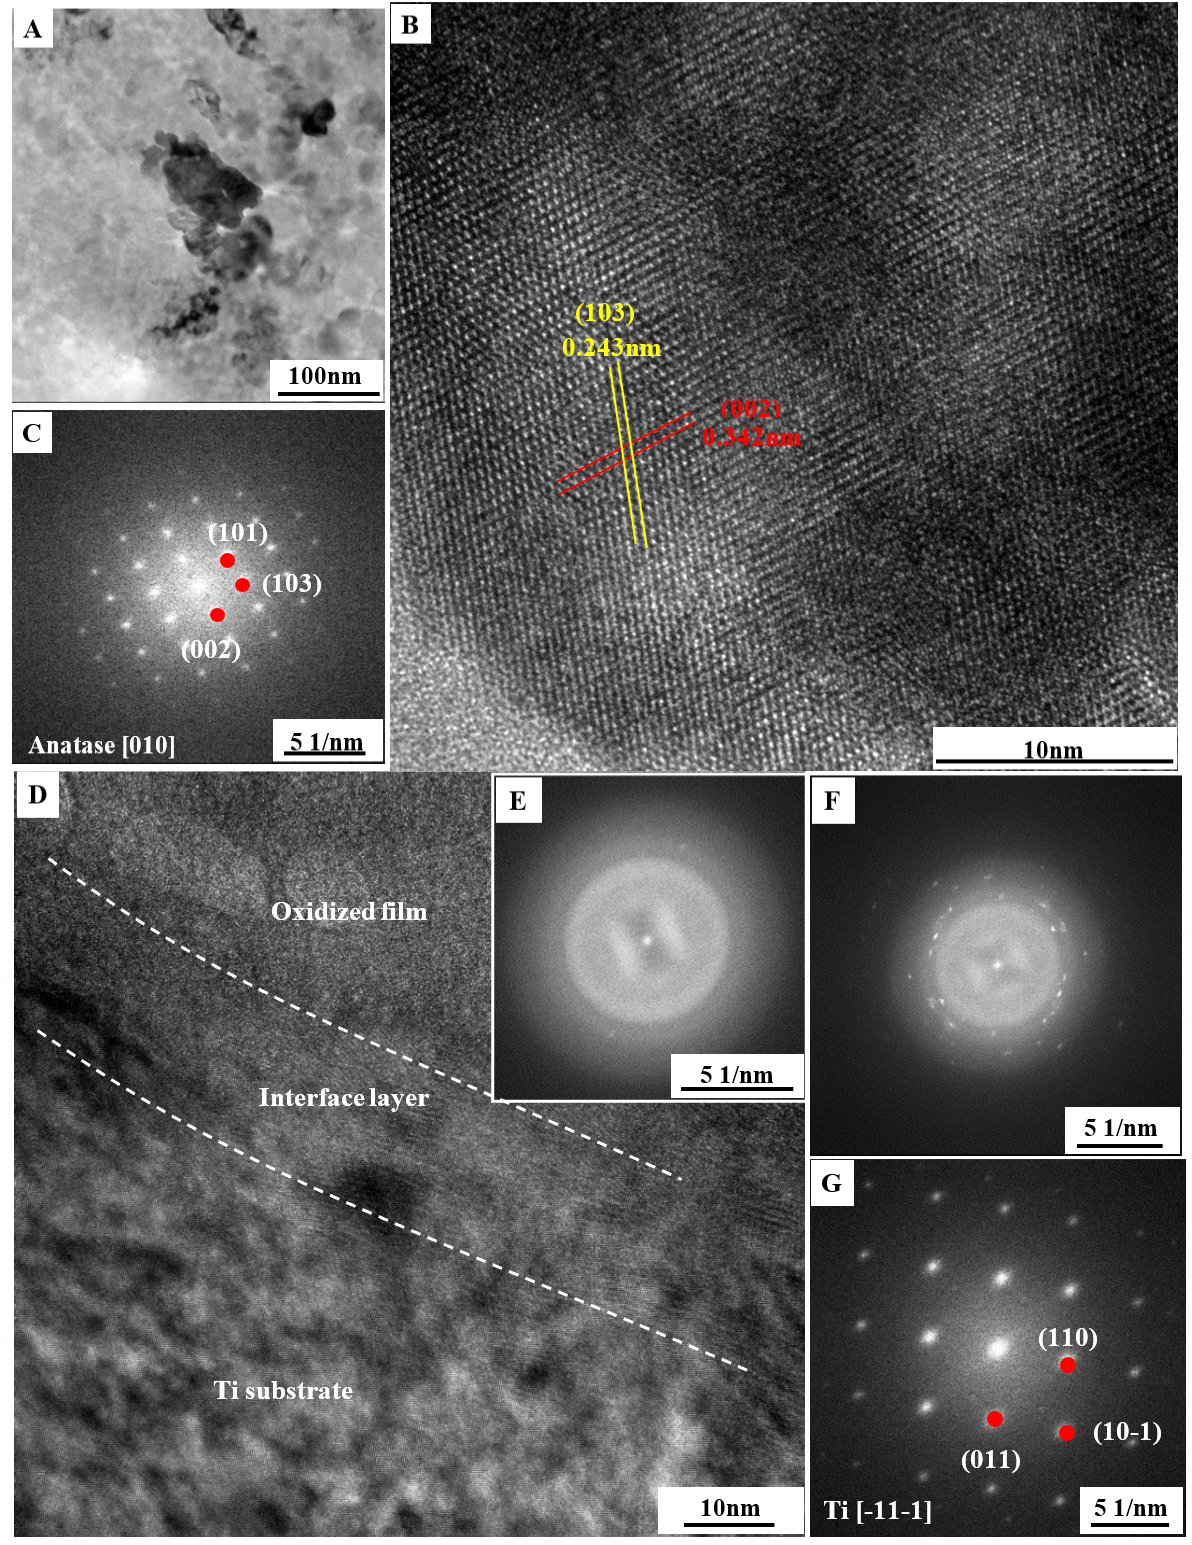
Figure 3. TEM magnified image, HRTEM image and FFT image of region I and region II in the Figure 2A: (A-C) magnified TEM image, HRTEM and FFT images of region II; (D-G) Magnified TEM image and FFT images of region III.

Figure 3. TEM magnified image, HRTEM image and FFT image of region I and region II in the Figure 2A: (A-C) magnified TEM image, HRTEM and FFT images of region II; (D-G) Magnified TEM image and FFT images of region III.


All published articles are preserved here permanently:
https://www.portico.org/publishers/oae/


