

fig10
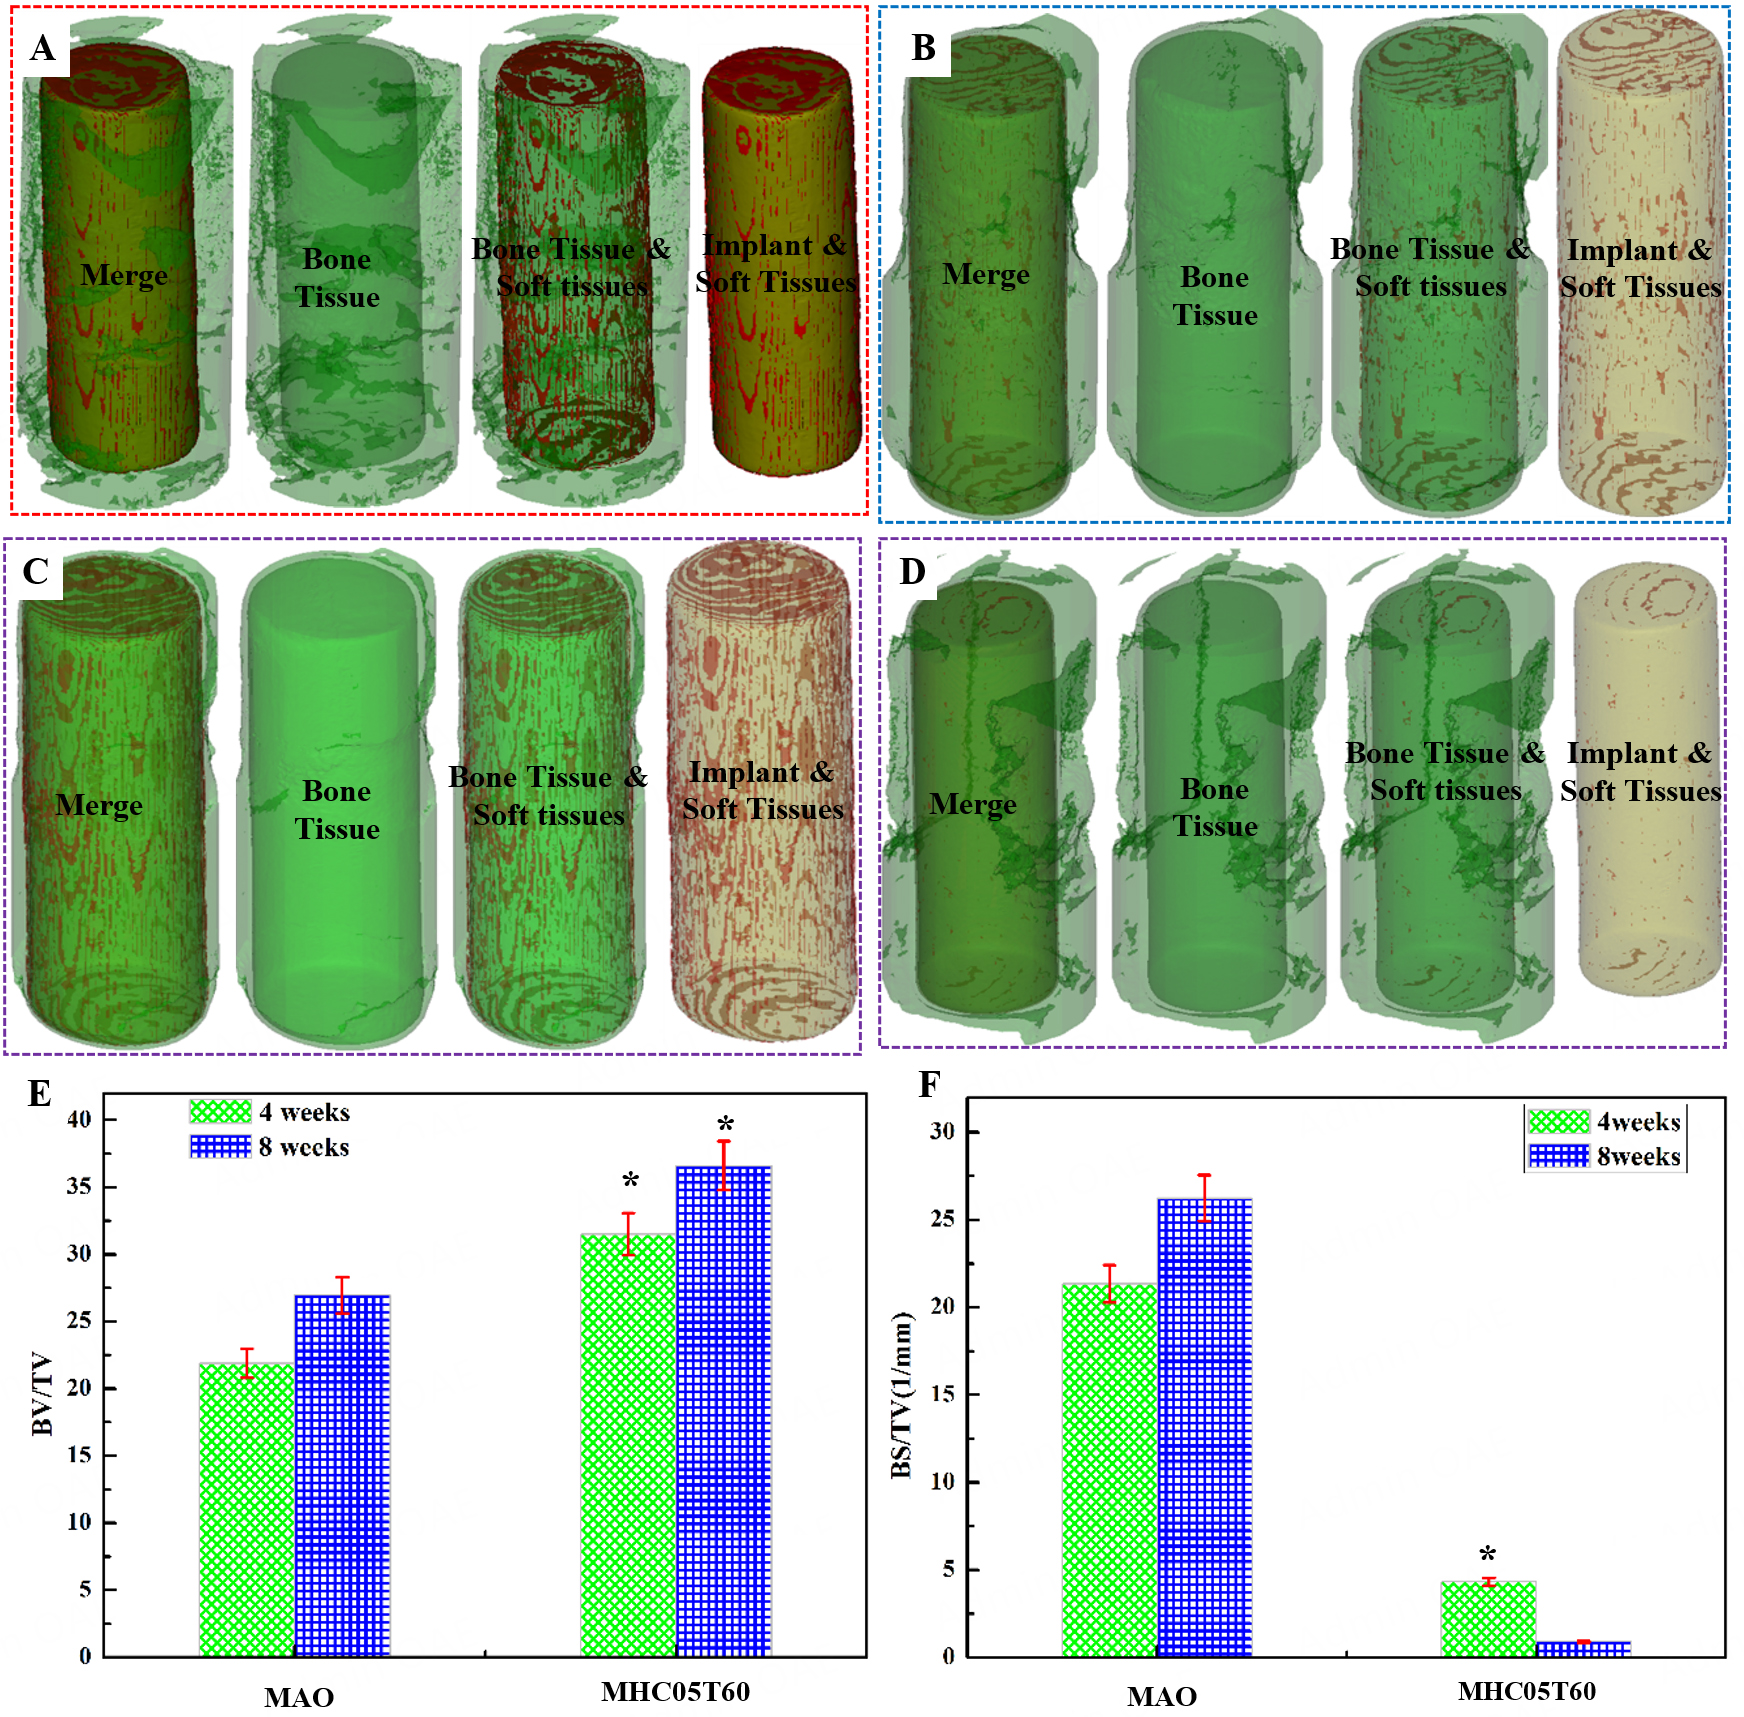
Figure 10. Micro-CT 3D color images and Statistical analysis for the MAO and MHC05T60 implant-bone complex at 4 and 8 weeks after implantation. (A and B) Micro-CT 3D color images for MAO implant-bone complex for 4 and 8 weeks; (C and D) Micro-CT 3D color images for MHC05T60 implant-bone complex for 4 and 8 weeks; (E) BV/TV; (F) BS/TV. Note: TV refers total volume of the tissues; BV refers biological tissue volume; BS refers the biological tissue surface area. *P < 0.05 compared to the MAO implant.





